
Research News


Harnessing the power of eye tracking in brain-machine interfaces
In recent years, eye tracking technology has advanced rapidly, suggesting that our eyes deserve greater attention within the evolving brain-machine interface (BMI) landscape. One particularly intriguing area is the connection between eye movements and internal brain states—a link that is becoming increasingly difficult to ignore. Eye tracking systems can function in a completely contactless manner, integrated into devices like screens, laptops, tablets, and smartphones. In contrast, wearable-based systems utilize wearable technology to monitor and even influence brain states, presenting a more hands-on approach to BMI development.
However, a promising alternative lies in the development of a framework that decodes hidden brain states, such as interoceptive awareness, directly from eye tracking data. This advance could help create safer, more efficient closed-loop systems that monitor and modulate the brain-body connection. That is the findings of a new study from the lab of Rose Faghih, Associate Professor of Biomedical Engineering at NYU Tandon.
Decoding the Brain’s Hidden Signals
Interoceptive awareness represents the brain’s ability to interpret bodily sensations—signals that arise in response to internal or external stimuli. However, these states are difficult to observe and must be decoded through physiological indicators. Tracking and understanding these internal brain states is critical for optimizing the brain-body connection, yet the challenge lies in how to access them.
One potential solution is to study interoception in the context of fear conditioning, a process where heightened arousal correlates with heightened interoception. In Pavlovian fear conditioning, subjects learn to anticipate aversive events—such as a mild electric shock—creating an ideal model for observing interoceptive signals. In a recent experiment, participants underwent fear conditioning and extinction, with mild electric shocks used as the aversive stimulus. Given the strong association between arousal and interoceptive awareness, researchers anticipated synchronized responses between these two states.
In this study, the research team decoded interoceptive awareness by analyzing neural activity linked to eye tracking data—specifically, measurements from pupillometry and eye gaze patterns. In parallel, they decoded arousal states from skin conductance data. While it was expected that the two states would show similar responses to the electric shock, the interoceptive awareness state, as inferred from eye tracking data, showed greater sensitivity to the mild shocks than the arousal state decoded from skin conductance.
This finding underscores the potential of eye tracking technology as a powerful psychophysiological tool for decoding interoceptive awareness, a signal that could offer significant insight into brain-body interactions.
Towards Future Closed-Loop Systems: The Dawn of ‘MINDCAM’
The discovery that eye tracking signals can serve as sensitive indicators of interoceptive awareness opens up exciting possibilities. These findings could pave the way for new therapeutic approaches to treating neuropsychiatric and neurodegenerative disorders. By decoding interoceptive awareness, future closed-loop systems may be able to restore and enhance the brain-body connection, offering safer, more personalized interventions.
One particularly promising application is the development of ‘MINDCAM’—a system that integrates eye-tracking-enabled cameras into devices like smartphones, tablets, and monitors. This technology could potentially monitor a user’s interoceptive awareness in real time, helping individuals regulate their mood and cognitive performance. However, while this research represents an exciting first step, much more work is needed to develop safe and effective closed-loop systems that can reliably decode and modulate interoceptive states.
Faghih’s previous research on wearables includes the development of ‘MINDWATCH,’ which uses information collected from electrical charges in skin to assess brain states. MINDCAM could be used to complement that technology to provide even better data on how the brain reacts to stress.
The integration of eye tracking technology into brain-machine interfaces may hold the key to unlocking deeper insights into the mind, offering new hope for improving mental health and cognitive function in the years to come.
This research was supported in part by National Institutes of Health (NIH) grant R35GM151353 - Maximizing Investigators' Research Award (MIRA) for Early Stage Investigators (ESI): MESH: Multimodal Estimators for Sensing Health and in part by National Science Foundation (NSF) under Grant 2226123 - Faculty Early Career Development Program (CAREER): MINDWATCH: Multimodal Intelligent Noninvasive brain state Decoder for Wearable AdapTive Closed-loop arcHitectures.
Saman Khazaei, Rose T Faghih, Eye tracking is more sensitive than skin conductance response in detecting mild environmental stimuli, PNAS Nexus, Volume 3, Issue 9, September 2024, page 370
Researchers harnessing exosomes and hydrogels for advanced diabetic wound healing
Diabetes, a widespread condition affecting approximately 13% of American adults, is often accompanied by complications such as impaired wound healing. If left unchecked, this can lead to severe outcomes, including the need for amputation. The challenge of finding effective treatments for diabetic wounds has grown increasingly urgent. Such wounds are marked by prolonged inflammation, lack of oxygen, and disrupted blood vessel formation, which all contribute to delayed recovery. However, a new frontier in biomedical research is pointing toward exosomes as a potential solution.
A team from NYU Langone and NYU Tandon including Jin Kim Montclare has began to explore exosomes, tiny membrane-bound vesicles, as promising tools for healing. These nanovesicles carry various biological materials — nucleic acids, proteins, and lipids — allowing them to mediate intercellular communication and influence processes such as tissue repair.
Specifically, exosomes derived from mesenchymal stem cells (MSCs), including those from adipose tissue, have demonstrated significant potential in promoting wound healing in animal models. Their therapeutic effects appear to stem from their ability to reduce inflammation and promote a healing-friendly environment by enhancing blood vessel formation and encouraging the activity of cells like fibroblasts and endothelial cells, which are essential for tissue repair.
One major advantage of exosomes is their ability to bypass some of the risks associated with traditional stem cell therapies, such as uncontrolled cell growth or immune rejection. However, despite their promise, exosomes typically require repeated administration—either through subcutaneous or intravenous injections—which poses a challenge for long-term wound management.
Montclare’s team have been exploring innovative ways to enhance the therapeutic potential of exosomes, one of which involves combining them with hydrogels. Hydrogels, composed of networks of cross-linked polymers, can encapsulate exosomes within their structure. This encapsulation enables a more sustained and localized release of exosomes directly at the wound site, without the need for invasive injections.
Hydrogels are already recognized for their biocompatibility and ability to hydrate wounds, making them useful as wound dressings on their own. When combined with exosomes, their therapeutic effectiveness increases significantly, especially for diabetic wounds.
Recent studies have shown that hydrogel-exosome combinations consistently lead to faster wound closure than either hydrogels or exosomes used alone. These hydrogel systems are not protein-based, but recent advances in protein-based hydrogel technology have opened new possibilities for improving wound healing.
Montclare has developed a protein-based hydrogel, referred to as "Q," which forms a gel at low temperatures through a process called upper critical solution temperature (UCST) gelation. This protein-based hydrogel self-assembles into nanofibers, forming a physically cross-linked network that provides mechanical strength. By fine-tuning the protein sequence using advanced computational tools, such as the Rosetta score and Poisson-Boltzmann electrostatic potential calculations, they have been able to improve the gel’s mechanical properties, stability, and speed of formation — key factors in creating an ideal wound dressing.
To push this approach further, they designed a variant of the Q hydrogel, dubbed Q5, using automated selection methods to optimize its stability. They encapsulated exosomes within Q5 to create a new hydrogel-exosome system, called Q5Exo. This system offers a topical, noninvasive wound dressing that holds promise for treating diabetic wounds more effectively than traditional methods, which rely on injections.
In studies using diabetic mouse models, Q5Exo demonstrated a significant reduction in healing time when applied topically compared to exosomes administered via injection. This suggests that protein-based hydrogels, with their tunable properties, could become a powerful platform for enhancing wound healing outcomes in diabetes. As research continues, such hydrogels could pave the way for a new generation of biocompatible, efficient wound dressings that harness the therapeutic power of exosomes.
Exosome Loaded Protein Hydrogel for Enhanced Gelation Kinetics and Wound Healing; Dustin Britton, Dianny Almanzar, Yingxin Xiao, Hao-Wei Shih, Jakub Legocki, Piul Rabbani, and Jin Kim Montclare; ACS Applied Bio Materials; 2024 7 (9), 5992-6000
NYU Tandon study finds political views, not race, shape reactions to mass shooting data
A new study from NYU Tandon School of Engineering suggests that when it comes to visualizations of mass shooting data, political ideology plays a more significant role in shaping emotional responses than racial identity. The research challenges assumptions about how people interpret data related to gun violence.
The study involved 450 participants who were shown visualizations — in this case, bar charts — of mass shooting victim data highlighting different racial groups. Contrary to the researchers' expectations, participants did not show stronger emotional responses when viewing data about victims of their own race.
"We anticipated seeing evidence of racial homophily, the tendency for people to identify more strongly with members of their own group," said Poorna Talkad Sukumar, a postdoctoral associate in NYU Tandon’s Technology Management and Innovation Department and the lead author on the research which will be presented at VIS2024 next month. "But our findings suggest that the gravity of mass shootings as a topic may override such in-group preferences."
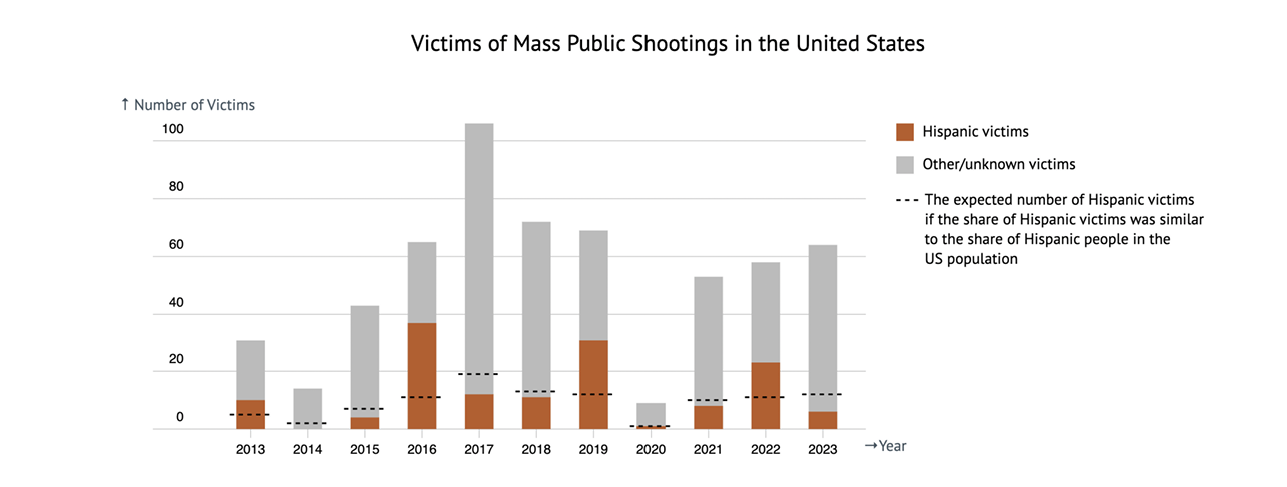
Data in this graph is from a real source. The source defines a mass shooting as an incident where four or more people, not including the shooter(s), were killed in a public space and not connected to another crime. Hispanic population percentage in the US for each year was obtained from census.gov.
Instead, the study found that political views were the strongest predictor of how participants reacted emotionally to the visualizations. Those with more liberal political leanings tended to have more negative emotional responses across all conditions.
Oded Nov, the NYU Tandon Morton L. Topfer Professor of Technology Management and a member of NYU Tandon’s Center for Urban Science and Progress (CUSP), is another author of the paper. He said the findings highlight the complex interplay between personal beliefs and data interpretation. "This research underscores how pre-existing ideological frameworks can shape our emotional reactions to information, even when presented in a seemingly neutral, visual format.”
Maurizio Porfiri, Director of CUSP and an Institute Professor in the Department of Mechanical and Aerospace Engineering and in the Department of Biomedical Engineering, is also an author of the paper. He suggested that “studies like this are critical to helping us identify best practices to present data on firearm violence and sensitize the general public about firearm-related harms.”
The study also revealed that even relatively simple bar charts elicited strong negative emotions from participants, regardless of their race or the racial group highlighted in the data. This finding could have implications for how sensitive topics are visually presented in media and public policy discussions.
The researchers note that their study had limitations, including a relatively small sample size, which limits the detection of subtle effects. They call for further research exploring different types of societal issues and visualization designs to better understand how viewer characteristics interact with data presentation.
As debates around gun violence and racial disparities continue to occupy national attention, this study offers valuable insights into how Americans process related information. It suggests that bridging ideological divides may be more crucial than addressing racial differences when it comes to fostering a shared understanding of mass shooting data.
This study contributes to Porfiri, Nov, and colleagues’ ongoing data-based research related to U.S. gun prevalence and violence, which they are pursuing under a 2020 $2 million National Science Foundation grant to study the “firearm ecosystem” in the United States. Prior published research under the grant explores:
- the role that population size of cities plays on the incidences of gun homicides, gun ownership and licensed gun sellers;
- motivations of fame-seeking mass shooters;
- factors that prompt gun purchases;
- state-by-state gun ownership trends; and
- forecasting monthly gun homicide rates.
arXiv:2408.03269v1 [cs.HC] 6 Aug 2024

NYU researchers lead team that developed bird migration tracking with call detection technology
A research team primarily based at New York University (NYU) has achieved a breakthrough in ornithology and artificial intelligence by developing an end-to-end system to detect and identify the subtle nocturnal calls of migrating birds.
This advancement enhances bird migration tracking, potentially equipping conservationists with new data to bolster avian protection efforts.
In a recent paper published in IEEE Transactions on Audio, Speech and Language Processing, the researchers — from NYU, Cornell Lab of Ornithology and École Centrale de Nantes in France — present their BirdVoxDetect system, detailing the core machine learning algorithms that drive this innovative bird call detection technology. The paper caps off the team’s eight-year study of the topic.
"We're now able to extract incredibly subtle patterns from these audio recordings that the human ear might miss," said Juan Pablo Bello, the team lead.
Bello is an NYU professor with appointments in both the Tandon School of Engineering (Computer Science and Engineering and Electrical and Computer Engineering Departments) and the Steinhardt School of Culture, Education and Human Development (Department of Music and Performing Arts Professions). He is the director of NYU’s Music and Audio Research Lab and a member of NYU Tandon’s Center for Urban Science and Progress.
The system can detect bird calls, identify species and discard corrupted audio with greater accuracy than prior work, potentially allowing for more precise tracking of migration patterns.
This is like having a little army of expert birders with superhuman hearing and endless patience listening to the night sky" — Juan Pablo Bello
These advancements build upon earlier work published in the Journal of Applied Ecology, where the research team first demonstrated BirdVoxDetect's capabilities to predict the onset and species composition of large migratory flights. That study analyzed a full migration season's worth of audio data from microphones in upstate New York — over 4,800 hours of recordings.
The system uses advanced machine learning techniques to analyze terabytes of audio data collected by networks of microphones, automatically picking out the brief "chirps" that many birds use to communicate during nocturnal migration.
Traditional methods of studying migration, like radar and volunteer birdwatcher observations, have limitations. Radar can detect the flight’s biomass but can't identify species, while volunteer data is mostly limited to daytime sightings and indicative of occupancy rather than flight. Acoustic monitoring fills crucial gaps, allowing researchers to detect which species are migrating on a given night and more accurately characterize the timing of migrations. The research shows that data from a few microphones can accurately represent migration patterns hundreds of miles away.
The researchers have made their system freely available as open-source software, allowing other scientists to apply it to their own data. This could enable continental-scale acoustic monitoring networks to track bird migration in unprecedented detail.
"We're entering a new era where we can monitor migration across vast areas in real-time," Bello said. "That's game-changing for studying and protecting valuable, and potentially endangered, wildlife."
Such data could prove crucial for conservation efforts. Many migratory bird populations are in steep decline due to habitat loss, climate change and other factors. Better understanding of migration timing and routes could help inform protection strategies.
The authors suggest that acoustic monitoring should become an integral part of efforts to study and conserve migratory birds. The technology is particularly promising for remote or inaccessible areas where traditional observation is difficult.
"Acoustic sensors are relatively inexpensive and can operate autonomously for long periods," said Bello. "This opens up exciting possibilities for monitoring migration in places we've never been able to study before."
Bello, together with the Cornell Lab of Ornithology’s Andrew Farnsworth and Steve Kelling, started the BirdVox project in 2016. The multidisciplinary team also includes the study’s lead author Vincent Lostanlen of École Centrale de Nantes (formerly of NYU), Aurora Cramer, also NYU; Justin Salamon now at Adobe, as well as Benjamin M. Van Doren and Adriaan Dokter of the Cornell Lab of Ornithology. The work was primarily funded by the National Science Foundation (NSF), under grant numbers 1633259, 1633206 and ICER 1927743, with additional funding provided by Cornell University, the Leon Levy and Lyda Hill Foundations, Google, and WeAMEC project PETREL.
V. Lostanlen et al., "BirdVoxDetect: Large-Scale Detection and Classification of Flight Calls for Bird Migration Monitoring," in IEEE/ACM Transactions on Audio, Speech, and Language Processing, doi: 10.1109/TASLP.2024.3444486.

Immersive Computing Lab teams up with Meta to uncover how energy-saving tactics affect perceived quality of XR experiences
As the boundary between real and virtual experiences continues to blur, the challenge of balancing power efficiency and image quality in compact XR devices becomes increasingly critical. The Immersive Computing Lab directed by Qi Sun, assistant professor at the Center for Urban Science + Progress (CUSP) and in the Department of Computer Science and Engineering at NYU Tandon, explores just how closely XR can match human perception of reality. One key aspect of this effort is to ensure standalone XR devices can be used for extended periods without sacrificing image quality.
“XR devices have benefited various professional and societal scenarios, such as modeling human decision-making in urban disasters and first responder training,” said Sun. “These applications demand extended usage sessions. However, current XR devices may only last for 2 to 2.5 hours on a single battery charge, with about 40% of the energy consumption on XR headsets coming from the displays.”
Sun, computer science Ph.D. student Kenneth Chen, and collaborators from Meta recently presented their research at SIGGRAPH 2024, the International Association for Computing Machinery's Special Interest Group on Computer Graphics and Interactive Techniques. Their work “PEA-PODs: Perceptual Evaluation of Algorithms for Power Optimization in XR Displays”, which received an Honorable Mention for the Best Paper, evaluates six display mapping algorithms — power-saving techniques to maintain the image’s intended appearance while reducing display power use — and translates findings into a unified scale that measures perceptual impact.
“Meta is an industrial leader in the Metaverse and creator of XR devices like the Quest 3,” said Sun. “Our interdisciplinary team developed human subject studies and design optimization for future XR hardware.”
The study utilized two head-mounted displays: the HTC VIVE Pro Eye and Meta Quest Pro. The team investigated various techniques for optimizing XR display power use, including uniform dimming, luminance clipping, brightness rolloff, dichoptic dimming, color foveation, and whitepoint shift. Uniform dimming reduces brightness evenly across the display; luminance clipping restricts the intensity of the brightest areas; brightness rolloff dims brightness from the center to the edges of the visual field using eye-tracking; dichoptic dimming varies brightness between the eyes by dimming the display for one eye; color foveation reduces color detail in peripheral vision while maintaining sharpness in the center; and whitepoint shift adjusts the color temperature of the display to save power.
The researchers started with small pilot studies to identify optimal settings for each display mapping algorithm, ensuring the effects were neither too obvious nor too subtle. They then used these refined settings in a larger study to evaluate each technique’s performance. In the main study, 30 participants viewed 360° stereoscopic videos, toggled between reference and test videos, and then chose the one with the highest quality.
Before this study, there was no standardized method for measuring the perceptual impact of display mapping techniques. This research fills that gap by offering insights into the most efficient techniques for saving power, optimizing display settings, and assessing tradeoffs. Among the methods tested, brightness rolloff emerged as the most efficient and whitepoint shift had a more noticeable negative effect on image quality.
“This research paves the way for the Immersive Computing Lab’s core mission of developing human-aligned wearable displays and generative AI algorithms,” said Sun. “In particular, it guides the future of visual computing systems as to how each watt of energy or each gram of CO2 is consumed to create content that is meaningful to humans and environments.”
Chen, K., Wan, T., Matsuda, N., Ninan, A., Chapiro, A., & Sun, Q. (2024). PEA-PODs: Perceptual Evaluation of Algorithms for Power Optimization in XR Displays. ACM Transactions on Graphics (TOG), 43(4), 1–17.
Towards open and standardized human mobility data: NYU Tandon researchers address key challenges and solutions
Despite the vast amounts of human mobility data generated by smartphones, a lack of standardized formats, protocols, and privacy-protected open-source datasets hampers innovation across various sectors, including city planning, transportation design, public health, emergency response, and economic research. The absence of established benchmarks further complicates efforts to evaluate progress and share best practices.
Takahiro Yabe, assistant professor at the Center for Urban Science + Progress (CUSP) and Department of Technology Management and Innovation at NYU Tandon, recently collaborated with a team of researchers — Massimiliano Luca (Fondazione Bruno Kessler), Kota Tsubouchi (LY Corporation), Bruno Lepri (Fondazione Bruno Kessler), Marta C. Gonzalez (University of California, Berkeley), and Esteban Moro (Northeastern University) — to advocate for the necessity of open and standardized human mobility data. Their opinion piece, published in Nature Computational Science, builds upon the recent release of the open-source, anonymized, large-scale human mobility dataset YJMob100K developed by several authors of this paper.
"The creation of the YJMob100K dataset and associated HuMob Challenge 2024 was motivated by our concern that similar human mobility datasets are exclusive to select researchers and industry organizations," said Yabe.
Unpacking the complexities of human mobility data pre-processing
Tracking a journey from origin to destination using mobile phone data is not straightforward. Data can vary significantly depending on the application employed, and datasets may not capture all transit modes. Inconsistencies in definitions, classifications, and data tags can introduce biases.
For example, defining what constitutes a "stop" — whether it’s a pause of 5 minutes, 30 minutes, or an hour — can be somewhat subjective. “To detect a stop within a mobility trajectory, data scientists need to define arbitrary hyperparameters such as the minimum number of minutes spent at the stop and the maximum movement distance allowed from the stop centroid,” noted the authors. “With several hyperparameters needed for each pre-processing step, a slight change in the selection of these parameters could result in a very different processed human mobility dataset.”
Pre-processing human mobility data is critical for protecting individual privacy. However, the methods used in this process are often kept confidential, creating a "black box" problem that raises concerns about data validity and accuracy. To address these issues, companies evaluate datasets by comparing them with external sources such as census data. However, researchers aiming to introduce and evaluate new methods for predicting human mobility continue to face a significant hurdle: there is currently no standard open benchmark dataset.
Advancing human mobility research with the YJMob100K dataset
The authors propose two strategies for approaching this challenge: creating synthetic, privacy-preserving human mobility datasets using machine learning models, or anonymizing a large-scale mobility dataset through collaboration with a private company. The latter strategy was employed for YJMob100K, which was developed through a collaboration involving Takahiro Yabe from NYU Tandon, Yoshihide Sekimoto and Kaoru Sezaki from the University of Tokyo, Esteban Moro and Alex Pentland from MIT, along with Kota Tsubouchi and Toru Shimizu from the private Japanese internet company LY Corporation.
The YJMob100K dataset was anonymized by converting location pings into 500x500 meter grid cells and aggregating timestamps into 30-minute intervals while masking the actual dates. Individuals who contributed data signed a consent form outlining the frequency and accuracy of location data collection as well as its intended use. All data processing and analysis were conducted on servers managed by the company.
To promote the dataset, the authors initiated the Human Mobility Prediction Challenge (HuMob Challenge) in 2023, which is currently underway for its second year. Selected entries will be showcased at the ACM SIGSPATIAL conference, taking place in Atlanta from October 29 to November 1, 2024.
"Inspired by advancements in natural language processing models like transformers, many submissions in the 2023 edition used AI and machine learning approaches," said Yabe. "Eight of the top ten submissions used deep learning techniques. With over 85 teams and 200 participants from 22 countries, the overwhelming response motivated us to continue into 2024. This year's challenge is more advanced, targeting predictions for cities that lack data."
The authors have identified several key challenges they aim to address in their future work. First, they aim to establish criteria for creating “fit-for-purpose” benchmarking datasets to achieve consensus within the research community. This involves defining clear metrics for data specification and establishing industry standards for pre-processing. Second, recognizing that different tasks require different types of data, they propose creating a collection of “fit-for-purpose” datasets, each tailored to specific research domains, communities, and socio-spatial-temporal contexts. This necessitates a bottom-up approach led by relevant research communities to ensure the datasets are well-aligned with their intended uses.
Yabe, T., Luca, M., Tsubouchi, K., Lepri, B., Gonzalez, M. C., & Moro, E. (2024). Enhancing human mobility research with open and standardized datasets. Nature Computational Science, 4(7), 469-472. https://doi.org/10.1038/s43588-024-00650-3
AI produces Connections puzzles that rival human-created ones
Can artificial intelligence (AI) create word puzzles as engaging and challenging as those crafted by human experts?
A new study suggests the answer may be yes — at least when it comes to The New York Times' popular Connections game.
Researchers from NYU Tandon School of Engineering and Jester Labs have developed an AI system capable of generating novel Connections puzzles that often rival those created by Times puzzle designers.
In a user study, participants played both AI-generated and official Times puzzles without knowing their source. In roughly half of head-to-head comparisons, players judged the AI puzzles to be equally or more enjoyable, creative, and difficult than their human-created counterparts.
Their findings shed light on the creative capabilities of large language models like GPT-4.
Connections, which debuted in June 2023, challenges players to sort 16 words into four thematically linked groups of four. The game quickly became one of the Times' most popular online offerings, second only to Wordle, with billions of plays per year.
To create AI-generated puzzles, the researchers employed an "agentic workflow" approach. This method involves using GPT-4 in multiple specialized roles throughout the puzzle creation process.
Rather than asking the AI to generate an entire puzzle at once, researchers broke down the task into smaller, more focused steps. For each step, they prompted GPT-4 with specific instructions, effectively having it play different roles such as puzzle creator, editor, and difficulty assessor.
This approach allowed the team to leverage the AI's capabilities more effectively by guiding it through a process that mimics how human designers might approach puzzle creation.
"We found that solving a complex problem like generating a Connections puzzle requires more than just asking an AI to do it," said Timothy Merino, a Ph.D. student in NYU Tandon’s Game Innovation Lab who is the lead author of the study. "By breaking the task into smaller, more manageable steps and using the LLM as a tool in various ways, we achieved better results."
The paper’s senior author, Julian Togelius — NYU Tandon associate professor of computer science and engineering, and the Director of the Game Innovation Lab — emphasized the importance of this approach. "The LLM is crucial to our system, but it's not in the driving seat. We use it in different parts of the system for specific tasks, like asking for the best concept that would apply to a particular list of words."
The researchers also identified two key ways puzzles introduce difficulty: "Intentional overlap" and "False groups." They analyzed word similarity in relation to difficulty levels, finding that easier word groups tend to have more similar words, while trickier groups have less similar words.
“I was consistently surprised at how good GPT was at creating a clever word group,” said Merino. “One of my favorites the AI generated is ‘Beatles Album Words’: ‘Abbey’, ‘Mystery,’ "Pepper,’ and ‘White.’”
The research has implications beyond word games, according to the researchers. It is a step toward better understanding both AI capabilities and human creativity.
"This work isn't just about generating puzzles," Togelius said. "It's about using AI to test and refine our theories of what makes a good puzzle in the first place. Connections is a worthy area of research because what makes a good game isn’t easy to define. We can refine our understanding of game design by creating theories of what makes for good games, implement them into algorithms, and see whether the games that are generated by the algorithms are actually good."
This recent paper builds upon the Game Innovation Lab's ongoing research into AI and Connections. In a study published earlier this year, the lab's researchers evaluated various AI models' proficiency in solving Connections puzzles. Their findings revealed that while GPT-4 outperformed other models, it still fell short of mastering the game, successfully solving only about 29 percent of the puzzles presented.
Merino, Tim & Earle, Sam & Sudhakaran, Ryan & Sudhakaran, Shyam & Togelius, Julian. (2024). Making New Connections: LLMs as Puzzle Generators for The New York Times' Connections Word Game.

Subway air pollution disproportionately impacts New York City's minority and low-income commuters
A comprehensive study on New York City's subway air quality has revealed that longer commute times lead to higher exposure to hazardous air pollutants, a problem that disproportionately affects minority and low-income communities who endure more prolonged and frequent travel through the system.
In a paper published in PLOS ONE, NYU Tandon School of Engineering researchers modeled subway riders' typical daily commutes to determine exposure to particulate matter pollution (PM2.5). This was done by integrating home-to-work commute data with pollutant measurements the researchers collected from all platforms and within a typical car in all train lines throughout the NYC subway system.
Masoud Ghandehari -- a professor in NYU Tandon’s Civil and Urban Engineering Department and a member of C2SMARTER, a Tier 1 University Transportation Center designated by the U.S. Department of Transportation -- led the research team. Other researchers on the paper include its first author, Shams Azad, who earned a Ph.D. in Transportation Engineering from NYU Tandon in 2023, and Pau Ferrar-Cid, Machine Learning Researcher at Universitat Politècnica de Catalunya in Spain who was an NYU Tandon visiting scholar in 2022.
PM2.5 refers to tiny particles suspended in the air that, when inhaled, can enter the lungs and potentially the bloodstream, causing a range of short- and long-term health complications. These include respiratory and cardiovascular diseases, and some components have also been identified as neurotoxins.
PM2.5 are traditionally byproducts of fossil fuel combustion. In the subway system, however, the particles are introduced as a result of abrasion of breaks, rails, and wheels, contributing to very high iron content in the collected and analyzed particles.
An NYC Air Pollution Exposure Map the researchers created can be used to calculate personal exposure for any origin and destination within New York City.
The burden of disease due to exposure to poor air quality in the subway system does not fall equally, the study found. Black and Hispanic workers face PM2.5 exposure levels 35% and 23% higher, respectively, compared to their Asian and white counterparts, according to the study.
This disparity stems from differences in commuting trends, duration of subway travel, and the varying pollution levels across stations and lines. Minority workers residing in low-income communities often endure longer commutes, transferring through stations (which are more polluted than subway cars) in order to reach job hubs like downtown Manhattan.
Economically disadvantaged communities generally are exposed to more pollutants compared to affluent workers. A positive correlation was identified between the percentage of residents below the poverty line and higher levels of PM2.5 exposure.
This discrepancy is partly attributed to the reliance on the subway system among lower-income populations, who have limited access to alternative transportation options like private vehicles or carpool services. Conversely, many affluent workers can avoid lengthy subway commutes by living in proximity to their workplaces.
In fact, residents in upper Manhattan neighborhoods, including Washington Heights and Inwood — two communities with poverty rates above citywide averages — have the highest per capita levels of subway pollutant commuting exposure, the study shows. This is due to a combination of a large number of commuters and longer commute time. Midtown Manhattan — where many people live close to workplaces — and portions of Queens without easily accessible subway stations have some of the lowest per capita exposure levels.
Measurements were carried out in December 2021 and June 2022, sampling 19 distinct subway lines and 368 stations. The researchers took end-to-end round trips on each of the lines studied, measuring the PM2.5 concentration at one-second sampling intervals. In one direction they stayed on the train from start to end. On the return trip they got off at each station and waited until the arrival of the next train, measuring the platform concentrations at the same sampling interval.
Sampling of the platform air at one-second intervals confirmed that pollutant concentration peaks when the train arrives, where the train churns up the pollutants deposited in the tunnel throughout years of service. The concentration values from the 2021 study can be found in a paper published in Atmospheric Pollution Research.
To calculate PM2.5 exposure, researchers used origin-destination records from the U.S. Census Bureau (specifically the 2019 LEHD Origin-Destination (OD) dataset) to simulate home-to-job commutes of over 3 million workers in Manhattan, Brooklyn, the Bronx, and Queens in 2019, calculating the average per capita daily PM2.5 exposure in 34,000 census blocks.
This study was a collaboration between the NYU Tandon School of Engineering and the NYU Grossman School of Medicine, in partnership with the Polytechnic University of Catalunya. The work was funded by NYU Tandon's C2SMART Center, with a grant from the U.S. Department of Transportation’s University Transportation Centers Program under Grant Number 69A3551747124, and by the National Science Foundation (award number 1856032). For more information, see also A Comprehensive Analysis of the Air Quality in the NYC Subway System (September 2022).
Azad, S., Ferrer-Cid, P., & Ghandehari, M. (2024). Exposure to fine particulate matter in the New York City subway system during home-work commute. PLOS ONE, 19(8), e0307096. https://doi.org/10.1371/journal.pone.0307096

New research explores how ant colonies regulate group behaviors
In the world of social creatures, from humans to ants, the spread of behaviors through a group — known as social contagion — is a well-documented phenomenon. This process, driven by social imitation and pressure, causes individuals to adopt behaviors observed in their peers, often resulting in synchronized mass actions; Think of stampedes, or standing ovations.
Social contagion is a double-edged sword in highly integrated societies. While it facilitates cohesion and collective efficiency, unchecked contagion can lead to detrimental mass behaviors, such as mass panic. Thus, nature has evolved regulatory mechanisms to keep such behaviors in check.
One such mechanism is reverse social contagion. In reverse social contagions, increased interactions between individuals engaged in a behavior lead to a higher likelihood of them stopping that behavior, rather than engaging in it.
In a new paper published in PNAS Nexus, researchers led by Maurizio Porfiri — NYU Tandon Institute Professor of Professor of Biomedical Engineering, Mechanical and Aerospace Engineering, and Civil and Urban Engineering, as well as the director of its Center for Urban Science and Progress (CUSP) — describe this unique phenomenon in colonies of harvester ants (Pogonomyrmex californicus) in order to understand the energetic consequences of highly integrated social behavior.
“Ants colonies reduce their energy spending per individual as the colony grows, similar to the size-dependent scaling of metabolic costs in birds and mammals discovered by Kleiber almost a century ago,” said Porfiri. “To date, a convincing explanation of how this collective response emerges is lacking.”
Utilizing tracked video recordings of several colonies, they discovered that individual ants did not increase their activity levels in proportion to the colony size. This was a curious finding, because larger colonies means more interactions between their members, and more opportunities for reinforcing behaviors.
To decode this behavior, the team — who also includes Pietro De Lellis from the University of Naples, Eighdi Aung and (Tandon alum) Nicole Abaid from Virginia Tech, Jane S. Waters from Providence College, and Santiago Meneses and Simon Garnier from the New Jersey Institute of Technology — applied scaling theories typically used to study human settlements. They derived relationships linking colony size to interaction networks and activity levels, hypothesizing that reverse social contagion was at play. Their hypothesis was supported by respirometry data, which revealed a potential connection between ant activity and metabolism.
Imagine you are an ant, and you see one of your fellow workers foraging for food. If you are governed by social contagion, you might also begin foraging so you don't look lazy. But the energy you expend foraging might not be worth it if one ant can efficiently gather the food. In this case, reverse social contagion tells you to kick your feet up and relax while you let your compatriot do the work, because you’ll need your energy later for another task. In this way, restraining social contagion makes the colony more efficient.
The study draws a fascinating parallel between insect colonies and human cities. In both systems, social interactions influence energy expenditure, but in opposite directions. Insect colonies exhibit hypometric scaling—activity levels do not increase proportionally with colony size. In contrast, human cities show hypermetric scaling, where energy expenditure grows faster than the population size.
“Human behavior is often driven by personal gain” says Simon Garnier, Associate Professor of Biological Sciences at NJIT and senior author on the paper. “Ants, on the other hand, tend to prioritize the needs of the colony over their own. This has huge implications for understanding the differences between the organization of human and social insect societies.”
Unlike humans, ants manage their energy as a colony rather than individually, somehow displaying a cooperative response. This study shows that ants use reverse social contagion to regulate their overall activity and energy use. Essentially, when many ants are busy with a task, some will stop to prevent the entire colony from overworking. This behavior aligns with scaling laws and metabolic patterns seen in other biological systems.
In simpler terms, think of an ant colony as one big organism where every ant's actions are coordinated for the colony's benefit, not just their own. Future research will look into how exactly these ants communicate and manage their energy so efficiently.
This research not only sheds light on the regulatory mechanisms in ant colonies but also offers insights into the broader principles of social regulation across species. As we continue to explore these parallels, we may uncover more about the fundamental dynamics that govern both natural and human-made systems.
“This is the first step we are taking to understand and model energy regulation in ant colonies,” said Porfiri. “Is energy regulation accompanied by improved performance for the collective? Can we design algorithms for robot teams inspired by ants that can maximize performance and minimize energy costs? Can we learn some lessons for our city transportation networks? These are just some of the questions we would like to address next. ”
This work was funded in part by a $3 million grant from the National Science Foundation, which over five years will aim to create a new paradigm for a better understanding of how loosely connected units can nonetheless collectively maintain function and homeostasis.
Porfiri, M., De Lellis, P., Aung, E., Meneses, S., Abaid, N., Waters, J. S., & Garnier, S. (2024). Reverse social contagion as a mechanism for regulating mass behaviors in highly integrated social systems. PNAS Nexus, 3(7). https://doi.org/10.1093/pnasnexus/pgae246
Arizona’s chief election officer endured more Twitter attacks than any other similar state official during 2022 midterm elections, new study reveals
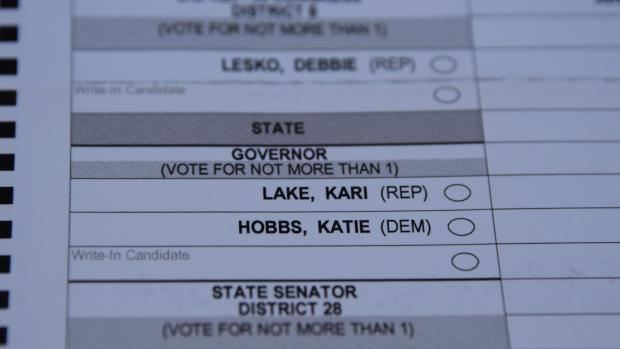
In the lead-up to the 2022 U.S. midterm elections, Arizona's chief election officer Katie Hobbs received far more harassing messages on Twitter than any of her counterparts in other states. Over 30 percent of all tweets directed at her, along with commentators on her posts, fell into the "most aggressive" category of attacks.
That is a finding from researchers at NYU Tandon School of Engineering, Universidad del Rosario in Colombia, and the University of Murcia in Spain, in a paper published in Information Fusion that examines the phenomenon of online intimidation targeting state election administrators.
The research team used a machine learning model from the Perspective API – a tool developed by Google to identify abusive online comments – to analyze nearly 600,000 tweets mentioning chief state election officials nationwide during the weeks surrounding November 8, 2022. These tweets were rated based on six attributes: toxicity, severe toxicity, identity attack, insult, profanity, and threat.
Arizona produced the most Twitter activity in the study, representing almost ninety percent of all collected tweets, and had by far the highest volume of toxic language directed at its top election official, who was also running for governor. Sentiment analysis revealed these messages exhibited high rates of overt "attacks on the author" and "attacks on commenters," as well as generalized toxicity and inflammatory rhetoric.
"Many of the harassing messages made connections to the 2020 presidential election and baseless conspiracy theories about electoral fraud," said Damon McCoy, the paper’s senior author, a professor of Computer Science and Engineering at NYU Tandon. McCoy is co-director of Cybersecurity for Democracy, a multi-university research project of the Center for Cybersecurity at NYU Tandon and the Cybersecurity and Privacy Institute at the Northeastern University Khoury College of Computer Sciences that aims to expose online threats and recommend how to counter them.
To further investigate, the researchers employed entity recognition software to automatically detect references within the hateful messages. It flagged prevalent mentions of "Watergate" and inflammatory phrases like being "at ground zero" for election integrity issues when discussing Arizona.
Clustering analysis based on semantic similarities within the messages also allowed the researchers to identify distinct communities promoting hate speech and map their interactions.
While political speech is constitutionally protected, the researchers warn that abuse and intimidation of election workers could have a chilling effect, deterring qualified professionals from overseeing voting and eroding public trust.
"If we want to safeguard democracy, we must find ways to promote civil discourse and protect those ensuring fair elections from harassment and threats," said McCoy.
The study proposes using the data pipeline developed by the researchers to automatically detect abusive accounts and content for faster content moderation. It also calls for clearer policies around harassment of election officials and cultural shifts to uphold democratic norms.
The research adds to McCoy’s body of work that delves into identifying and combating online threats and misinformation that can harm democracy and civic life. Other studies have investigated the monetization of YouTube political conspiracy channels, looked at how well Facebook identifies and manages political ads on its platform and explored U.S. political Facebook ads in Spanish during the 2020 presidential election.
Zapata Rozo, A., Campo-Archbold, A., Díaz-López, D., Gray, I., Pastor-Galindo, J., Nespoli, P., Gómez Mármol, F., & McCoy, D. (2024). Cyber democracy in the digital age: Characterizing hate networks in the 2022 US midterm elections. Information Fusion, 110, 102459. https://doi.org/10.1016/j.inffus.2024.102459