NYC ranks safest among big U.S. cities for gun violence, new research from NYU Tandon School of Engineering reveals

New York City ranks in the top 15 percent safest of more than 800 U.S. cities, according to a pioneering new analysis from researchers at NYU Tandon School of Engineering, suggesting the effectiveness of the city’s efforts to mitigate homicides there.
In a paper published in Nature Cities, a research team explored the role that population size of cities plays on the incidences of gun homicides, gun ownership and licensed gun sellers.
The researchers found that none of these quantities vary linearly with the population size. In other words, higher population did not directly equate to proportionally higher rates of gun homicides, ownership, or gun sellers in a predictable straight-line way across cities. The relationships were more complex than that.
This finding prompted the researchers to apply a data analytics measure called Scale-Adjusted Metropolitan Indicators (SAMIs), to filter out population effects, allow a fair comparison between cities of different sizes, and support principled analyses of the interplay between firearm violence, ownership, and accessibility.
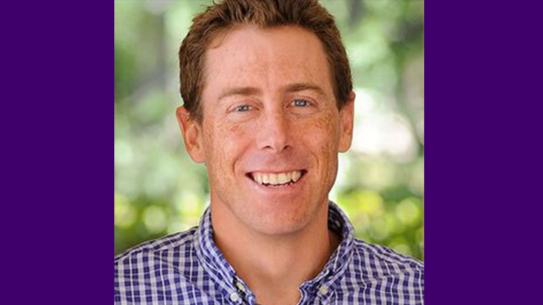
“People often cite per capita rates of gun violence as evidence about whether gun laws work in any given metropolis — or even how safe cities are compared to each other — but that actually isn't completely accurate,” said Maurizio Porfiri, the paper’s senior author. Porfiri is Director of the NYU Tandon Center for Urban Science and Progress (CUSP) and an Institute Professor in the Departments of Mechanical and Aerospace Engineering and Biomedical Engineering.
“SAMI shows us that some large cities with higher per capita rates of gun violence might actually be doing a better job of curtailing gun harms than their smaller counterparts with lower per capita rates.”
Porfiri and Rayan Succar, a Ph.D. candidate in Mechanical Engineering and CUSP, collected and analyzed data on the amount of gun homicides and armed robberies, gun ownership, and licensed gun sellers in about 800 cities ranging in size from about 20 million (metro area) to 10,000.
With SAMI, they uncovered that firearm homicide and robbery rates scale superlinearly, disproportionately concentrating in larger cities like NYC.
In contrast, gun ownership scales sublinearly, with larger cities having fewer guns per capita than their smaller counterparts. Gun violence rates are higher per capita in cities with bigger populations due to the presence of causative factors there, including bigger income disparities and the proximity of people to each other.
By studying cities' deviations from scaling laws, the researchers established rising homicide rates quantitatively cause more firearm ownership, likely due to self-protection concerns. Easier access to licensed gun sellers also directly drives up ownership, with more access in smaller cities.
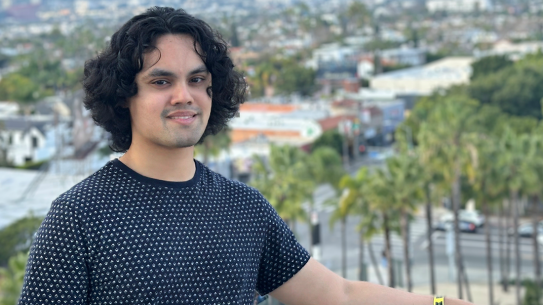
"Our research finds evidence for the theory of self-protection, wherein people will buy firearms out of fear for their own and their loved ones' lives,” said Succar.
The per capita homicide rates in New York City are significantly lower than what urban scaling laws models anticipate, considering the city's size and its gun ecosystem, researchers found.
"So while many people see New York as unsafe, our population-adjusted analysis makes it clear the city is doing far better on homicide prevention than you'd probably guess. In fact, it comes out on top of the country’s 10 biggest metros,” said Succar.
“Our study provides a robust quantitative basis for evaluating the effectiveness of local policies to reduce shootings,” said Porfiri. “We plan to expand this urban scaling theory and causal discovery approach globally to decode complex dynamics shaping cities worldwide.”
This study contributes to Porfiri’s ongoing data-based research related to U.S. gun prevalence and violence, which he is pursuing under a $2 million National Science Foundation grant he received in 2020 to study the “firearm ecosystem” in the United States. This is the first of his studies that examines data at the city level. Previous projects looked at data at the state and national level. His published research has focused on motivations of fame-seeking mass shooters, factors that prompt gun purchases, state-by-state gun ownership trends, and forecasting monthly gun homicide rates.
To see the ranked lists of all cities in this study, visit Github. A summary is below:
HOMICIDE SCORES - SAMI
Highest: cities that experience higher homicide rates than what their size would predict
- Helena-West Helena, AR
- Clarksdale, MS
- Selma, AL
- Greenville, MS
- Indianola, MS
- Grenada, MS
- Blytheville, AR
- Greenwood, MS
- Pine Bluff, AR
- Bennettsville, SC
Lowest: cities that experience lower homicide rates than what their size would predict
- Mount Pleasant, MI
- Rexburg, ID
- Huntingdon, PA
- Auburn, IN
- Willmar, MN
- Fremont, NE
- Dickinson, ND
- Ithaca, NY
- Kearney, NE
- Lincoln, IL
FIREARM OWNERSHIP SCORES - SAMI
Highest: cities that experience higher ownership rates than what their size would predict
- Natchitoches, LA
- Bastrop, LA
- Cleveland, MS
- Tuscaloosa, AL
- Statesboro, GA
- Americus, GA
- Brenham, TX
- Anniston-Oxford-Jacksonville, AL
- Albany, GA
- Troy, AL
Lowest: cities that experience lower ownership rates than what their size would predict
- Gallup, NM
- Kahului-Wailuku-Lahaina, HI
- Auburn, NY
- Eagle Pass, TX
- Ithaca, NY
- Kapaa, HI
- Hilo, HI
- New York-Newark-Jersey City, NY-NJ-PA
- Lamesa, TX
- Freeport, IL
LICENSED FIREARM DEALER SCORES - SAMI
Highest : cities that have more licensed dealers in them than what their size would predict
- Prineville, OR
- Spearfish, SD
- Fredericksburg, TX
- Helena, MT
- Prescott, AZ
- Kalispell, MT
- La Grande, OR
- Jefferson City, MO
- Enterprise, AL
- Greeley, CO
Lowest: cities that have fewer licensed dealers in them than what their size would predict
- Pecos, TX
- Raymondville, TX
- Eagle Pass, TX
- El Centro, CA
- Clarksdale, MS
- Crescent City, CA
- New York-Newark-Jersey City, NY-NJ-PA
- Santa Cruz-Watsonville, CA
- San Francisco-Oakland-Hayward, CA
- Salinas, CA


