
Takahiro Yabe
,
Ph.D.
-
Assistant Professor

Dr. Takahiro Yabe is an Assistant Professor at the Department of Technology Management and Innovation (TMI) and the Center for Urban Science + Progress (CUSP).
His research focuses on computational social science and network science approaches to model the resilience of cities to disasters, pandemics, and disruptive mobility technology, and has been published in journals including Nature Human Behaviour, PNAS, Nature Communications, and Nature Machine Intelligence. Previously, he was a Postdoctoral Associate at the MIT Institute of Data, Systems and Society (IDSS) and the MIT Media Lab with Alex 'Sandy' Pentland and Esteban Moro. He obtained his Ph.D. from Purdue University in 2021, and his MS and BS from the University of Tokyo in 2017 and 2015, respectively.
Urban Resilience
Human Mobility
Inequality and Segregation
Socioeconomic Networks
Education
Postdoc, Massachusetts Institute of Technology (2021 – 2023)
Ph.D., Purdue University (2017 – 2021)
MS, The University of Tokyo (2015 – 2017)
Bachelor of Engineering, The University of Tokyo (2011 – 2015)
Selected Awards and Grants
- Nice Step Researcher Award (2024), Ministry of Education, Culture, Sports, Science and Technology of Japan
- Emerging Award (2024), Complex Systems Society
- Vice Presidential Unit Award (2022), The World Bank, to GFDRR mobility data analytics team
- Top 10% Citation Award (2021), PLoS ONE, for “Cross-comparative analysis of evacuation behavior after earthquakes using mobile phone data”
- Doctoral “Systems” Fellowship (2018 – 2020), Purdue University
- STV Civil Engineering Graduate Assistantship Endowment Award (2020), Lyles School of Civil Engineering, Purdue University
Selected Publications
- Yabe, T., Bueno, B. G. B., Dong, X., Pentland, A., & Moro, E. (2023). Behavioral changes during the COVID-19 pandemic decreased income diversity of urban encounters. Nature Communications, 14(1), 2310.
- Yabe, T., Rao, P. S. C., Ukkusuri, S. V., & Cutter, S. L. (2022). Toward data-driven, dynamical complex systems approaches to disaster resilience. Proceedings of the National Academy of Sciences, 119(8), e2111997119.
- Yabe, T., Jones, N. K., Rao, P. S. C., Gonzalez, M. C., & Ukkusuri, S. V. (2022). Mobile phone location data for disasters: A review from natural hazards and epidemics. Computers, Environment and Urban Systems, 94, 101777.
- Yabe, T., Tsubouchi, K., Fujiwara, N., Sekimoto, Y., & Ukkusuri, S. V. (2020). Understanding post-disaster population recovery patterns. Journal of the Royal Society Interface, 17(163), 20190532.
- Yabe, T., Tsubouchi, K., Fujiwara, N., Wada, T., Sekimoto, Y., & Ukkusuri, S. V. (2020). Non-compulsory measures sufficiently reduced human mobility in Tokyo during the COVID-19 epidemic. Scientific reports, 10(1), 18053.
Research News
When Disaster Strikes, People Often Flee to Places That Feel Familiar
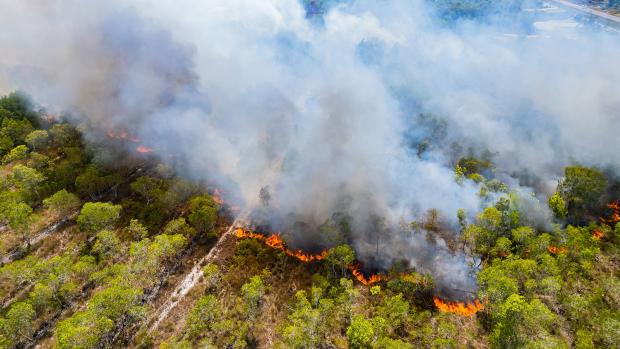
When the Marshall Fire tore through suburban Colorado in late 2021, residents had only hours to decide where to go. Some fled to nearby towns. Others stayed farther away for weeks or months. Now a recent study published in Humanities and Social Sciences Communications suggests those decisions were shaped not only by distance or danger, but also by something more human: the pull of familiar communities and social ties.
Researchers at NYU Tandon analyzed anonymized mobile phone location data from more than 200,000 devices in Colorado before and after the fast-moving wildfire, which destroyed more than 1,000 homes and displaced thousands of people. They combined those movement patterns with demographic data and measures of social connectedness between neighborhoods. Their conclusion: evacuees were more likely to choose destinations that resembled their home communities or where they had stronger social links.
“Even during a chaotic emergency, people do not move randomly,” says lead author Takahiro Yabe, Assistant Professor of Technology Management and Innovation and the Center for Urban Science + Progress. “They tend to seek places where they feel socially connected or where the community feels familiar.”
The study adds nuance to how scientists understand evacuation behavior. Traditional models often assume people head to the nearest available safe place or to larger population centers. But this research found that social factors strongly influenced where people actually went.
Most evacuees relocated between 20 and 60 kilometers from the fire zone, suggesting many wanted to remain relatively close to home. Yet when researchers compared real evacuation destinations with simulated destinations based only on population size and distance, the real destinations scored significantly higher for demographic similarity and friendship connections. In other words, people often chose places where they knew someone, or places that looked socially like where they came from.
The findings also revealed inequality in who could access those familiar refuges. Residents from whiter, wealthier, and more highly educated neighborhoods were more likely to evacuate to destinations with stronger social similarity and connectedness. Black, Asian, and lower-income populations were less likely to do so. That gap may matter because social networks can provide practical help during crises: a spare bedroom, child care, transportation, local knowledge, or emotional support.
“Access to social capital can shape recovery just as much as physical damage does,” says Vaidehi Raipat, a PhD candidate and lead author on the paper. “If some groups have fewer options to relocate into supportive communities, that can deepen existing inequalities after disasters.”
The team also examined what happened after the initial evacuation. People who relocated to areas with stronger social connectedness were more likely to return home over the following months. But those who moved to places that were demographically similar to their original communities were somewhat less likely to return, suggesting that a comfortable temporary destination may sometimes become a longer-term alternative.
That distinction could help officials plan for future climate disasters, which are becoming more frequent and more destructive. Wildfires, floods, and storms increasingly force sudden movement, yet emergency planning still tends to focus on roads, shelters, and hazard maps rather than the social geography of where people want to go.
The researchers argue that disaster response could improve by accounting for community ties. Knowing where evacuees are likely to head could help agencies position aid, anticipate population surges, and better support displaced residents. It could also identify people who lack strong networks and may need more assistance.
The study focused on one wildfire, so its authors caution that patterns may differ in hurricanes, floods, or other disasters. Still, the broader message is clear: in moments of upheaval, people often search not just for safety, but for belonging.
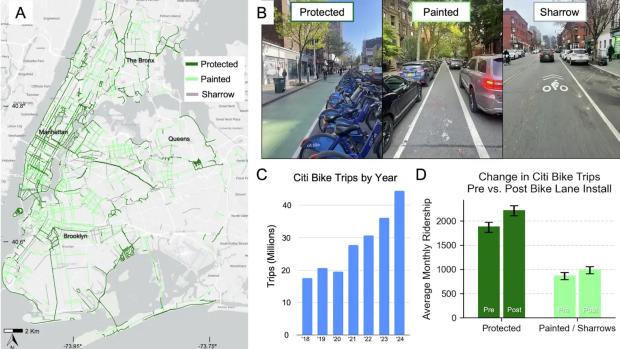
Protected Bike Lanes Causally Increase NYC Bikeshare Ridership, But Benefits Are Not Distributed Equally
Protected bike lanes increase Citi Bike ridership in New York City, but painted bike lanes and sharrows do not show a statistically significant causal effect on ridership after accounting for confounding factors, according to a new study from researchers at NYU's Tandon School of Engineering published this week in npj Sustainable Mobility and Transport.
The findings address a longstanding question in transportation planning: if and to what extent do different types of bicycle infrastructure actually encourage more people to ride.
Protected bike lanes physically separate cyclists from vehicle traffic using barriers such as curbs, parked cars, or flexible posts. Painted bike lanes provide only a painted stripe between cyclists and cars, while sharrows are bicycle symbols painted onto shared traffic lanes.
Using approximately 72 million Citi Bike trips recorded between 2013 and 2024 (a period of significant ridership growth), the researchers linked trip data to bicycle infrastructure located near stations across New York City.
Initial results suggested that both protected and painted facilities were associated with increased ridership. Stations near newly-installed protected bike lanes saw an average increase in trips of 18%, while stations near painted bike lanes and sharrows experienced an average increase of about 14%.
However, those initial before-and-after comparisons do not account for the fact that bike lanes are often installed in areas where cycling activity is already increasing.To isolate the effects of the infrastructure itself, the researchers used propensity score matching and difference-in-differences analysis, statistical methods designed to compare similar locations while controlling for pre-existing neighborhood characteristics and ridership trends.
After applying those methods, only protected bike lanes showed a statistically significant causal effect on Citi Bike ridership. The researchers estimated an average increase of approximately 379 additional rides per station per month following installation of protected lanes. In contrast, painted bike lanes and sharrows did not show a statistically significant causal effect on ridership.
"Not all bike lanes are created equal," said Takahiro Yabe, Assistant Professor in the Department of Technology Management and Innovation (TMI) and the Center for Urban Science + Progress (CUSP) at NYU Tandon School of Engineering. "When cities invest in cycling infrastructure, the design details can determine whether a lane simply exists on a map or actually changes how people travel. That matters for transportation, public health, and sustainability, especially when cities are making difficult choices about how to invest limited resources."
"Painted bike lanes and sharrows may cost less and face less political pushback, but we now have evidence at a massive scale that protected bike lanes are really what can move the needle on ridership," said Marcel Moran, the lead author of the paper. Moran is currently an Assistant Professor at San José State University, and was a Faculty Fellow at CUSP during this project.
The study also examined whether the effects of protected bike lanes differed across neighborhoods. The researchers found that the positive ridership effect was statistically significant only in Census block groups with the lowest share of Black residents. In neighborhoods with higher shares of Black residents, they did not detect a statistically significant causal effect on Citi Bike ridership.
"Protected bike lanes seem to work best where cycling was already a realistic option for people,” said Malik Salman, a paper co-author. Salman is an NYU CUSP alumni and currently a CUSP Research Scholar in Yabe’s lab. “In communities where residents face other barriers — cost, discriminatory policing, a history of being left out of the planning process — the infrastructure alone may not be enough to change behavior. That's not an argument against building protected lanes. It's an argument for doing more alongside them."
The results were more encouraging for older adults. In Census block groups with the highest share of residents between ages 60 and 79, protected bike lanes produced particularly strong ridership gains. The researchers suggest that older adults may be especially responsive to infrastructure that reduces perceived traffic-safety risks. This aligns with evidence from cities like Copenhagen, which feature an expansive network of protected bike lanes, as well as high ridership among older adults.
The study comes as New York City's bicycle network has expanded from roughly 900 miles of bike lanes in 2014 to approximately 1,500 miles by 2024, while Citi Bike recorded a system-high of roughly 45 million trips in 2024. The authors say their methodology could be applied to other cities with publicly available bikeshare and bike-lane data, including Chicago, Boston, San Francisco, and Washington, D.C.
Moran, M., Salman, M. & Yabe, T. Heterogeneous impacts of protected bike lanes on bikeshare behavior across demographic groups in New York. npj. Sustain. Mobil. Transp. 3, 39 (2026). https://doi.org/10.1038/s44333-026-00107-2

Downtown Brooklyn as a Living Lab for AI-Driven Retail Planning
In Downtown Brooklyn, decisions about where to open a coffee shop, attract a retailer, or fill a vacant storefront could soon be informed by an unlikely source: artificial intelligence trained on how people actually move through the neighborhood.
A new research project from the Resilient Urban Networks Lab, led by Takahiro Yabe — an assistant professor at the Center for Urban Science and Progress (CUSP) and the Department of Technology Management and Innovation at NYU Tandon School of Engineering — is using anonymized mobility data and advanced AI models to better understand how people choose where to spend time and how those choices shape the local economy.
Developed in collaboration with the Downtown Brooklyn Partnership (DBP), the work aims to provide a practical tool for retail planning and economic development.
At the core of the project is a system that models thousands of individuals as “AI agents,” each representing a type of person who lives, works, or visits Downtown Brooklyn. Using mobile phone location data, demographic information, and business attributes, researchers created a “synthetic population” of roughly 20,000 agents that simulate real-world behavior.
“We’re essentially building something like SimCity, but grounded in real human behavior,” said Yabe.
These agents can be used to test “what-if” scenarios, such as how foot traffic might change if a new retailer opens, a grocery store is introduced, or a popular café closes. Earlier research could estimate the economic spillover effects of business closures, but this approach goes further by simulating how entirely new additions, such as parks, retail stores, or entertainment venues, might reshape activity across the neighborhood.
“For retail operators, real estate developers, and property owners, one of the biggest challenges is uncertainty,” said Yabe. “This framework allows us to test scenarios before making costly decisions, whether that’s introducing a new tenant, redesigning a space, or rethinking an entire retail mix. The goal is to turn data into a practical decision-making tool that reduces risk and improves outcomes for neighborhoods.”
For organizations like the DBP, which helped shape the research questions and provided local context, the goal is not just to understand behavior but to support decisions about retail strategy. This includes identifying what types of businesses should fill vacant storefronts to attract visitors and encourage them to stay longer in the area.
“They help us frame the right questions,” Yabe said, noting that the Partnership has been closely involved in identifying real-world use cases and providing information about local business openings, closures, and potential tenants.
"Understanding where people go and why is the foundation of a healthy retail market," said Mark Landolina, Senior Director of Real Estate and Economic Development at DBP. "This research gives us the ability to simulate how foot traffic and consumer demand shift when a new business opens or closes before it happens. That means we can go to landlords and tenants with concrete, data-backed recommendations about what types of businesses belong where, taking the guesswork out of leasing decisions and helping the market respond to real demand. That's how you fill the right storefronts with the right businesses and build a stronger Downtown Brooklyn."
Early findings highlight how interconnected the neighborhood’s economy is. In one simulation, when a popular coffee shop was removed, customer demand did not shift to a single competitor. Instead, it spread across many nearby businesses, with most alternatives located within a short walking distance.
This pattern suggests that Downtown Brooklyn operates as a tightly linked retail ecosystem, where businesses share and redistribute foot traffic rather than compete in isolation. It also points to the importance of proximity and diversity in sustaining neighborhood vitality.
The research also demonstrates that everyday movement patterns, particularly predictable routines like weekday lunch trips, can be modeled with a high degree of accuracy. The model has been tested against real-world business openings and closures, and researchers say the level of predictive accuracy improves significantly when combining behavioral personas with spatial and business data.
“The level of accuracy we’re seeing is really, really high, especially for out-of-sample predictions compared to traditional machine learning approaches,” Yabe said.
While the current analysis focuses on restaurant visits as a starting point, the broader framework can be applied to a wide range of retail and urban planning questions, from tenant mix to long-term neighborhood development.
The project is part of NYU CUSP’s capstone program, a two-semester initiative in which students work with external partners to address real-world urban challenges. It was presented on May 1 at the Urban Data Science Showcase at NYU’s Brooklyn campus. The project, titled Enhancing Downtown Brooklyn’s Retail Market Through Data-Driven Interventions, was led by CUSP graduate students Sizhe (Alex) Xu and Divya Natekar, with Ph.D. students DongHak Lee and Boyang Li (CUSP, TMI) as student mentors, Yabe as the faculty mentor, and the DBP serving as the project sponsor.
About DBP Living Lab:
Downtown Brooklyn is a place where collaboration and innovation come together to solve real problems. Through our Living Lab program, DBP partners with groups to solve quality of life challenges facing cities, using Downtown Brooklyn as a platform to test technologies and generate real-world insights. This initiative is a perfect example of what the Living Lab is all about, bringing NYU Tandon's cutting-edge research and technology to work right in our own backyard.

Research reveals economic ripple effects of business closures, remote work and other disruptions
With remote and hybrid work now an established norm, many restaurants located adjacent to office buildings are facing a permanent decline in foot traffic. But how will this behavioral shift ripple through businesses along commute routes? Does it trigger a chain reaction that extends far beyond the immediate vicinity of a commercial hub?
In a new paper published in Nature Human Behavior, a team of researchers led by NYU Tandon School of Engineering’s Takahiro Yabe and Northeastern University’s Esteban Moro have shown how connections between businesses stretch far beyond proximity when human behavior data is factored into the equation. The result shows that businesses — from gas stations to laundromats — can see large changes in their revenues, even if they're not located in major business districts.
“Urban science views cities as complex adaptive systems, rather than entities that can be engineered with straightforward solutions,” says Yabe, Assistant Professor at the Department of Technology Management and Innovation and the Center for Urban Science and Progress. “Our research contributes to understanding how changes in urban environments influence human behavior and economic dynamics. By focusing on dependencies between businesses and points of interest, we can help cities design more effective, equitable policies and infrastructure.”
Traditional models for measuring interdependence of businesses largely rely on their physical proximity to one another. The research team, which also included researchers from the University of Pittsburgh and MIT — analyzed anonymized mobile phone data from over a million devices across New York, Boston, Los Angeles, Seattle, and Dallas, tracking how people move between businesses and other points of interest throughout the day. This allowed researchers to create detailed "dependency networks" showing how different establishments rely on each other's customer base – and how far disruptions can spread.
This integration allowed them to refine predictions of business resilience during disruptions — such as those triggered by the COVID-19 pandemic — boosting accuracy by a staggering 40% compared to traditional models that relied solely on geographic proximity.
These networks revealed surprising patterns. While traditional models focused mainly on immediate neighbors – like a coffee shop next to a closed office building – the reality is far more complex. The study found that airports can significantly impact businesses up to 2.5-3.5 kilometers away, while even supercenters and colleges influence businesses within a 1.5-kilometer radius.
The researchers were also able to show how different types of establishments create varying ripple patterns. While shopping malls and colleges tend to have strong but localized effects, airports, stadiums, and theme parks can send economic shockwaves across entire urban areas. Perhaps most surprisingly, arts venues, restaurants, and service businesses can experience substantial impacts even when they're far from the source of the disruption. This can provide key takeaways for people to design and run cities.
“This network has significant potential for urban planners and policymakers,” says Yabe. “For example, organizations like Business Improvement Districts (BIDs) can use it to identify synergies between parks and surrounding businesses, optimizing economic growth. Planners can also simulate the impacts of interventions, like congestion pricing or new infrastructure, to anticipate ripple effects throughout the city.”
The publication is accompanied by an interactive visual dashboard, inviting users to simulate disruptions and observe how they impact a city’s economic landscape. Through a detailed map of POI’s in Boston, users can see exactly how much connectivity individual businesses have with those in their communities and beyond, and explore how business closures affect points far beyond their blocks or neighborhoods.
This research builds upon previous research of Yabe and his colleagues. Last year, they started a National Science Foundation-funded project on how EV chargers affect dining, shopping, and other activity patterns, and aim to provide policy makers with tools to support small and medium-sized businesses through their judicious placement. The project explores how and where charging stations should be placed to not only meet drivers’ needs but also enhance the economic resilience of local businesses and promote social equity.
The improved accuracy of business resilience predictions during disruptions such as pandemics or climate change-induced natural disasters is a crucial development for urban planners and policymakers working to strengthen the economic stability of cities. This insight makes a compelling case for shifting from a place-based to a network-based approach to planning and managing urban economies — one that recognizes that the health of a city's economy is a web of interconnected threads. The closure of an office or museum may seem like an isolated event, but within the tightly woven fabric of urban economies, it can reverberate with far-reaching effects.
Research Centers, Labs, and Groups