Yuki Miura
-
Assistant Professor

For Prospective Students:
Contact me to join my research group to leverage urban and climate data to identify, quantify, and mitigate climate risks and natural hazards while collaborating with stakeholders to develop actionable solutions.
Dr. Miura is an assistant professor at the Department of Mechanical and Aerospace Engineering and the Center for Urban Science and Progress at NYU. She is also a faculty advisory board member at the Volatility and Risk Institute at NYU Stern School of Business. She is a member of New York City Panel on Climate Change (NPCC5). Previously, she worked at Morgan Stanley in climate risk management and quantitative strategy.
Her research is at the intersection of engineering, climate science, finance, and social sciences. She develops data-driven strategies to mitigate natural hazards and build resilient cities. By coupling advanced modeling with in-depth understanding of socioeconomic factors, she provides actionable solutions for both public and private institutions. She has collaborated with the National Center of Atmospheric Research and the governments of New York State/City. Her work has been recognized through publications in leading journals and featured in The New Yorker and The New York Times.
- Urban resilience and adaptation
- Intersection of engineering, social science, and economics
- Data-driven modeling and optimization
Education
Columbia University, 2022
Doctor of Philosophy, Civil Engineering and Engineering Mechanics
Columbia University, 2021
Master of Philosophy, Civil Engineering and Engineering Mechanics
Columbia University, 2017
Master of Science, Civil Engineering and Engineering Mechanics
Keio University, 2015
Bachelor of Engineering, System Design Engineering
Experience
Morgan Stanley, 2022 - 2024
Climate Risk Management
Morgan Stanley, 2021, 2022
Quantitative Strategist
Research News
NYU Tandon and NEC Put a Price Tag on Flood Protection in the Rockaways
In the Rockaways, a peninsula neighborhood in Queens, New York City, decisions about where to invest in flood barriers, beach nourishment, or shoreline reinforcement could soon be backed by something that has long been missing from the conversation. A clear accounting of what those investments are actually worth.
A research project from NYU Tandon School of Engineering's Center for Urban Science and Progress (CUSP), developed in partnership with NEC Corporation, used geospatial analysis and economic modeling to do exactly that.
But the more disruptive question the project raises is not just what flood resilience is worth, but who is receiving that value, and why they are not yet part of the funding conversation.
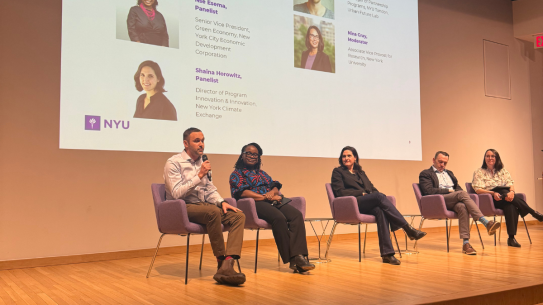
Developed through CUSP's Capstone Program, a two-semester initiative in which students work with external partners to address real-world urban challenges, the project was presented on May 1 at the Urban Data Science Showcase at NYU Tandon’s Brooklyn campus.
NEC and NYU have subsequently signed a Memorandum of Understanding (MOU) committing both organizations to further studies in urban disaster prevention, resilience, and advanced technology.
At the core of the project is a value chain framework that maps how a single flood protection investment generates ripple effects across transportation, housing, public health, and community wellbeing. Rather than treating these benefits as abstract, the team built five quantitative models that convert avoided damages into dollar figures.
"The central insight here is that flood resilience creates enormous economic value for stakeholders who have never been asked to contribute to its cost — transit operators, insurers, healthcare systems, tourism economies,” said the project’s Faculty Mentor Yuki Miura, assistant professor at CUSP and Tandon’s Department of Mechanical and Aerospace Engineering, and a member of the New York City Panel on Climate Change. “These are not passive bystanders to flood risk. They are material beneficiaries. Quantifying that stake is the first step to bringing them into the investment conversation."
The numbers are striking. Avoiding traffic disruption from roadway flooding amounts to an estimated $105 million over ten years. Mental health costs linked to flood-triggered trauma, drawing on post-Sandy PTSD rates three times the national average among Rockaway Peninsula residents, reach $501 million per major flood event.
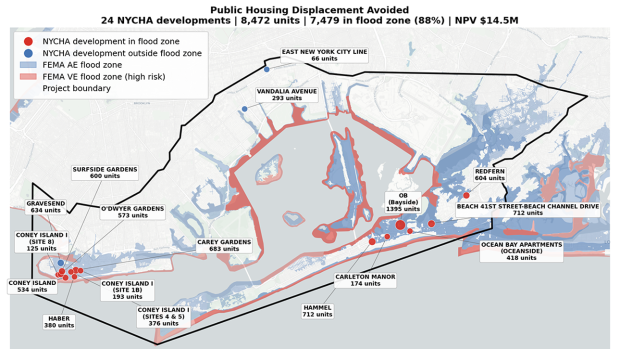
Emergency shelter costs for the 15,932 public housing residents living in the flood zone approach $16.5 million per event. Protecting beachfront tourism preserves an estimated $170 million in revenue over a decade. A fifth model accounts for the health burden that construction noise places on the roughly 44,000 residents living near active worksites.
Taken together, the analysis suggests losses of up to approximately $800 million could potentially be avoided through flood protection measures currently underway under the Greater Rockaway Resilience Plan.
The models were built using ArcGIS and Excel, integrating spatial flood hazard data with socioeconomic indicators, including land use, tax records, and demographics. Findings were validated through prior research comparisons and direct interviews with Rockaway residents, community organizations, and representatives from the public and private sectors.
"When we can show a health system that a flood barrier reduces its emergency admissions by a measurable margin, or show a transit authority the precise cost of service disruption it avoids, the question of who should fund resilience infrastructure starts to have a different answer," said Miura. "That is not only a Rockaways question. It is a question every city with a coastline is facing."
For NEC, whose expertise lies in value chain modeling and digital technologies, the project reflects a broader strategic priority.
"While strengthening resilience is urgent, public and private sector efforts often remain fragmented, and for individual projects, ROI is often unclear," said Ryutaro Adachi, Executive Professional at NEC's GX Business Development Division. "This research presents a basic framework for evaluating the economic impact of projects with ambiguous effects and suggests the potential for expanding future funding methods."
Eighty-eight percent of public housing units on the peninsula sit within the flood zone, and waitlists stretch beyond five years, meaning displaced residents have almost nowhere to go when flooding strikes.
While the Rockaways served as the test case, the framework is designed to generalize across geographies and infrastructure contexts. Under the MOU, NEC and NYU Tandon will explore opportunities for social implementation of the findings, including engagement with financial institutions on new financing methods made possible by technologies such as satellite image analysis, AI, and remote sensing.
The project was led by CUSP graduate students Christian Humann, Kamili Afra, and Ziming Xiong, with Miura as faculty mentor and Adachi and Takuo Shioda of NEC Corporation as project sponsors.
NYU Tandon Supports MTA in Combating Climate Threats
As transit agencies face growing climate risks and limited capital budgets, deciding which flood protection measures to implement — and where — has become a critical challenge.
Now, a research team at NYU Tandon School of Engineering has built a computer modeling framework that allows agencies to rapidly test and prioritize hundreds of subway resilience strategies for coastal storm surge flooding before committing to major infrastructure investments.
Developed in collaboration with researchers at Columbia University and Princeton University, the model enables the New York Metropolitan Transportation Authority (MTA) to simulate coastal storm surge flooding scenarios under different climate projections and evaluate which combinations of coastal barriers and station-level protections will provide the greatest return on investment.
The physics-based approach, published in Transportation Research, calculates flooding extent and economic losses for each scenario in about one minute on a standard laptop. This speed makes comprehensive resilience planning practical for the MTA, the state agency that oversees NYC's public transportation system.
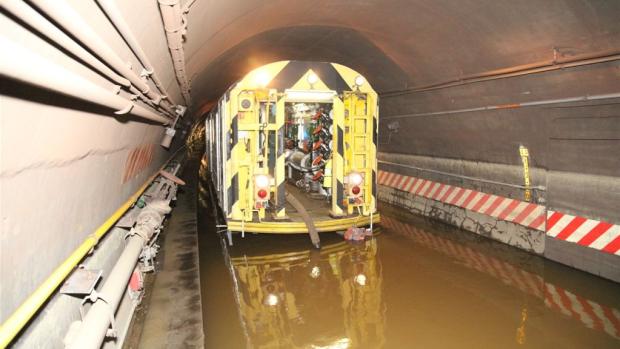
The research team validated its simulation by accurately reproducing Superstorm Sandy's 2012 flooding patterns. That storm inundated 150 subway stations across New York City, causing $5 billion in repair costs to stations, tunnels, and electrical systems, plus additional economic losses from extended service disruptions.
Since that event, the MTA has invested $7.6 billion in repairs and nearly 4,000 coastal surge protections, including elevating critical infrastructure, securing entrances at underground subway stations, and installing marine doors at the Hugh L. Carey and Queens Midtown tunnels.
“Protecting our infrastructure and the New Yorkers that rely on it from the impacts of climate change is one of the MTA's top priorities," said Eric Wilson, Senior Vice President of Climate & Land Use at the MTA. "Innovative tools like this give us a powerful, data-driven way to evaluate resilience investments before we build them, helping ensure every dollar we spend strengthens the system and safeguards service for millions of daily riders."
"As extreme storms become more frequent and sea level rises, transit agencies need reliable tools to determine how protective measures will actually perform in these changing circumstances before committing billions in infrastructure investments," said Yuki Miura, the study's lead author and assistant professor at NYU Tandon, where she is a faculty member in the newly established NYU Urban Institute. “Our model lets agencies rapidly compare hundreds of strategies under different future conditions. That makes it possible to identify solutions that are not only cost-effective, but also robust to uncertainty.”
Working with MTA and NYC government officials, the research team leveraged the model's speed to rapidly test numerous flooding scenarios for Lower Manhattan's subway system (below 34th Street). The study presents 13 representative stress tests through the end of the century, each combining Superstorm Sandy-level storm surges with projected sea level rise and various protective strategies.
The modeling shows that layered strategies — combining coastal barriers with targeted protection at key subway openings — can substantially reduce flood risk in a cost-effective and system-wide manner. Raising Lower Manhattan's entire coastline by two meters (about 6.5 feet) could prevent subway flooding even with mid-century sea level rise.
A hybrid approach — completing the East Side Coastal Resiliency seawall paired with sealing the 1,500 most critical of the subway's 3,500 openings (entrances, vents, stairways, and other entry points) — would cost about the same as sealing all 3,500 openings, but could also protect neighborhood streets, buildings, and infrastructure from coastal flooding, not only the subway itself. For the MTA, its 4,000 coastal surge protections are a critical first line of defense, and the East Side Coastal Resiliency seawall is a secondary protection.
The analysis reveals a counterintuitive finding: flood risk does not scale linearly. Instead, localized vulnerabilities at critical junctions can trigger cascading failures throughout the system, meaning strategic investments at a handful of key locations can be far more effective than broadly distributed protections.
In addition to calculating flood depths both above and below ground, the study quantifies economic impacts from subway inoperability. The researchers estimate a Superstorm Sandy-level storm today would cause $5.5 billion in economic losses to Manhattan from transit disruptions alone — separate from repair costs — given that 40-60% of New Yorkers depend on public transportation for daily commutes. This estimate does not account for the coastal surge protections that the MTA has implemented. These protections would be deployed by the MTA during a Superstorm Sandy-level storm, reducing the associated economic loss due to transit disruptions.
The research team developed the model in coordination with the New York City Transit Authority, a division of the MTA, which provided detailed system specifications, including tunnel dimensions, station volumes, and opening locations, while maintaining security considerations.
"We're grateful for the productive collaboration with the MTA," said Miura, who has faculty appointments in both Tandon's Center for Urban Science + Progress and its Mechanical and Aerospace Engineering Department. "Their engagement has been essential in developing a tool that supports evidence-based decision-making for infrastructure investments."
Miura points out that ongoing work is exploring how this framework can be integrated into long-term capital planning and adapted for other infrastructure systems facing climate risk. While this study focused on New York City, the methodology can be adapted to other coastal cities with underground transit infrastructure.
The research was supported by the National Science Foundation. The study's senior author is George Deodatis of Columbia University. Co-authors are Christine Y. Blackshaw of Princeton University, Michelle S. Zhang of Columbia University, and Kyle T. Mandli of the Flatiron Institute.
Yuki Miura, Christine Y. Blackshaw, Michelle S. Zhang, Kyle T. Mandli, George Deodatis,
Coastal storm-induced flooding risk of the New York City subway amid climate change,
Transportation Research Part D: Transport and Environment, Volume 149,2025, 104974, ISSN 1361-9209, https://doi.org/10.1016/j.trd.2025.104974.

NYU Tandon researchers launch interactive 3D flood map to help New Yorkers visualize climate risks
When Hurricane Sandy devastated New York City in 2012, it became clear that communicating flood risk through traditional probability maps wasn't enough.
Now, researchers at NYU Tandon School of Engineering have created GeoFlood Studio, an interactive 3D flood visualization platform that lets users see exactly how water would rise around their neighborhood during major storms.
"Talking about probability and technical terms in risk assessment often isn't digestible," said Yuki Miura, Assistant Professor in the Department of Mechanical and Aerospace Engineering and the Center for Urban Science + Progress, who leads the project. "We need realistic tools that people can understand."
GeoFlood Studio, developed over the past two months by Miura's Climate, Energy, and Risk Analytics (CERA) Lab, represents a significant advance over existing flood visualization tools. “While other 3D flood models exist, they typically offer limited scenarios, slow loading times, and basic flood-zone style information that shows only which areas might be underwater, without the level of detail on depth, velocity, and human vulnerability that our platform provides,” said Miura.
With GeoFlood Studio, users can explore scenarios based on Hurricane Sandy (coastal flooding) and Hurricane Ida (rainfall-driven flooding), each combined with projected sea level rise for 2050, 2080, and 2100. The tool allows examination of compound flooding scenarios where both storm types occur simultaneously.
The platform's interactive features include adjustable human silhouettes to show precisely how deep flood waters would reach at the user's height. Users can toggle velocity overlays to see how fast water is projected to move, or vulnerability overlays that show color-coded safety zones ranging from areas safe for driving to zones where adult life is in danger.
Users can also enable or disable the East Side Coastal Resiliency seawall to instantly see how this infrastructure protects against flooding.
"If flood depths are about two feet, you might think that’s not so dangerous. But if the velocity is high, the risk can be much greater than you expect. Conversely, if the velocity is low, you may still face challenges but have a better chance of safety," Miura explained.The map loads immediately, allowing users to click anywhere for instant data about flood depth, water velocity, and vulnerability (danger) levels. Users can select preset viewing locations across Lower Manhattan or navigate the 3D map freely.
Currently focused on Lower Manhattan, the platform is expanding rapidly. Within weeks, GeoFlood Studio will include evacuation routing capabilities, showing the safest path to emergency shelters while avoiding dangerous flood zones. The team plans to expand coverage to all of New York City within months and enable other researchers to upload their own flood scenarios by year's end.
Applications extend beyond academic research. Emergency management agencies can plan evacuation routes, insurance companies can assess property risks more accurately than traditional FEMA flood zone maps, and real estate developers can evaluate how proposed seawalls might protect properties.
"Asset management firms and insurance companies can use this to see exactly which areas will be underwater and how deep, going beyond the broad categories provided by FEMA’s flood zone maps," Miura noted.
The project reflects Miura's broader research mission to "identify, measure, and manage risks" through tools that work for both technical experts and community members. GeoFlood Studio is part of her larger body of work modeling urban flood risks, which includes developing rapid flood estimation tools that deliver real-time flood forecasts within seconds.
The team has gathered feedback from New York City agencies including the Department of Environmental Protection and the Mayor's Office, as well as local high school students and artists, ensuring the platform serves diverse users.
As climate change intensifies flood risks worldwide, GeoFlood Studio offers a model for making complex climate science accessible and actionable. By letting people see themselves in flood scenarios rather than reading statistics, the platform transforms abstract risk into a tangible, personal understanding.
NYU will showcase GeoFlood Studio during a public workshop on September 26, 2025 as part of NYU Climate Week 2025, inviting residents, practitioners, and policymakers to explore the tool and discuss how visual insights can drive climate adaptation planning.
Research Centers, Labs, and Groups