
When the Rain Comes, Some New York City Subway Riders Stay Home. Scientists Are Now Mapping Exactly Who, and Where
A new study from the NYU Tandon, University of Louisville, and the University of Hong Kong finds that a rainstorm can cut ridership by nearly 29 percent at one NYC station while barely denting another two miles away.
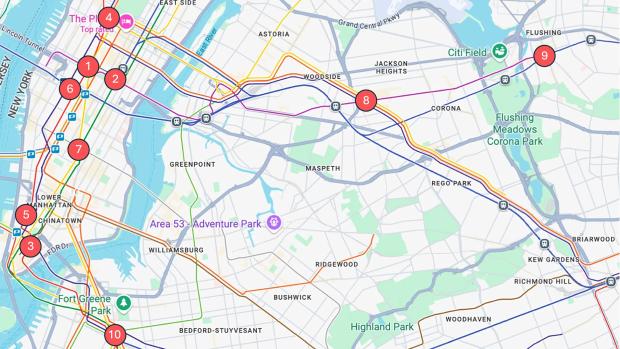
NYC Subway stations included in this study are distributed across Manhattan (Times Square-42nd St, Grand Central-42nd St, Fulton St, 59th St-Columbus Circle, Chambers St/World Trade Center (WTC)/Park Pl/Cortlandt, 34th St-Penn Station, 14th St-Union Square), Queens (74th St-Broadway/Jackson Heights-Roosevelt Av, Flushing-Main St), and Brooklyn (Atlantic Av-Barclays Center), collectively representing major transportation hubs, commercial centers, and residential neighborhoods. Map data ©2026 Google.
On a sweltering August afternoon or in the teeth of a winter storm, New York City subway riders make a quiet calculation: Is the trip worth it?
A new study published in npj Sustainable Mobility and Transport takes a detailed look at how those decisions show up in ridership patterns across the system, and how they vary from station to station.
Researchers from NYU Tandon, the University of Louisville, and the University of Hong Kong analyzed hourly ridership at 10 major subway stations between 2023 and 2025. Using a statistical technique called vine copula modeling, they examined how stations’ ridership moves together under different weather conditions rather than treating each station as an isolated case.
“Think about what actually happens when a storm hits,” said Joseph Chow, one of the paper’s authors and an NYU Tandon Institute Associate Professor. “There is structure in how the riders of a system respond to the storm, almost like a unique “signature” of the system to a type of extreme weather event. Understanding these structures and how they evolve can help different cities better prepare their public transit systems to be resilient against extreme weather events.”
Heavy precipitation has the strongest effect during the evening rush hour. As detailed in the appendix, median declines during heavy rain range from nearly 29 percent at Columbus Circle to less than 8 percent at Grand Central. Outer-borough stations such as Flushing–Main Street also show large declines, approaching 26 percent.
Evening travel is more flexible than morning commutes, so heavy rain tends to shift or suppress trips rather than eliminate them entirely. Riders may leave earlier, wait out the storm, or cancel discretionary plans, leading to sharper drops during that specific peak hour even though most still get home, the researchers explained.
Extreme cold tells a different story. Even during the morning rush, when its effects are strongest, ridership declines are modest, generally between about 1 and 2.4 percent across stations. Larger effects appear off-peak, when discretionary trips are more likely to be canceled.
“Commuters maintain their routines even when temperatures plunge,” Chow said, who is also the Deputy Director of C2SMART, Tandon’s transportation research center. “It’s the discretionary traveler, the person heading to a restaurant or a friend’s apartment, who cancels the transit trip or switches to a different mode.”
The study also highlights sharp differences between nearby stations. Columbus Circle emerges as one of the most weather-sensitive locations during heavy rain, while Grand Central, less than two miles away, shows comparatively small declines.
That variation suggests borough location alone does not determine resilience. Infrastructure, station design, connectivity, and surrounding land use all appear to play a role.
“What we’re giving planners is a way to see the whole network respond to a storm or a heat wave, not just one station at a time. And this method allows them to generate other plausible ridership scenarios under extreme weather, aiding decision-making,” said Omar Wani, a NYU Tandon Assistant Professor and a paper author.
The authors emphasize important limitations. The analysis focuses on 10 high-ridership stations, and extreme weather events are relatively rare in the data. To address this, the model generates plausible ridership patterns based on observed relationships across stations.
That means the results should be interpreted as estimates of likely responses, rather than simple averages of past storms.
Even so, a clear pattern emerges. Heavy rain hits hardest during peak hours, while extreme cold has a greater effect off-peak, and the differences between stations are consistent rather than random.
The implications extend beyond operations. Because some neighborhoods rely more heavily on transit, uneven drops in ridership during extreme weather may translate into uneven burdens. As climate change increases the frequency of severe weather, understanding where and when riders stay home could help agencies plan more targeted responses.
In addition to Chow and Wani, the paper’s authors are Yan Guo and Brian Yueshuai He of the University of Louisville; and Zhiya Su of the University of Hong Kong. Funding for the research was provided by the National Science Foundation.
Guo, Y., He, B.Y., Chow, J.Y.J. et al. Assessing subway ridership resilience under extreme weather with vine copula modeling. npj. Sustain. Mobil. Transp. 3, 25 (2026). https://doi.org/10.1038/s44333-026-00094-4
Appendix
The tables below show median declines in ridership at the ten stations studied, compared with normal weather conditions. Each weather type is measured during the peak period when its effects are most pronounced, using the evening commute (4 to 5 p.m.) for heavy rain and the morning commute (8 to 9 a.m.) for extreme cold.
|
Station |
Borough |
Median Decline, |
|
Columbus Circle |
Manhattan |
-28.9% |
|
Flushing-Main St |
Queens |
-26.4% |
|
Fulton Street |
Manhattan |
-24.7% |
|
Times Square |
Manhattan |
-23.9% |
|
Chambers St/WTC |
Manhattan |
-21.5% |
|
Atlantic Av-Barclays Center |
Brooklyn |
-21.4% |
|
Broadway/Jackson Heights |
Queens |
-20.4% |
|
Penn Station |
Manhattan |
-19.3% |
|
Union Square |
Manhattan |
-10.2% |
|
Grand Central |
Manhattan |
-7.8% |
|
Columbus Circle |
Manhattan |
-2.4% |
|
Flushing-Main St |
Queens |
-2.4% |
|
Fulton Street |
Manhattan |
-2.0% |
|
Broadway/Jackson Heights |
Queens |
-2.0% |
|
Chambers St/WTC |
Manhattan |
-1.9% |
|
Penn Station |
Manhattan |
-1.8% |
|
Atlantic Av-Barclays Center |
Brooklyn |
-1.8% |
|
Times Square |
Manhattan |
-1.7% |
|
Grand Central |
Manhattan |
-1.1% |
|
Union Square |
Manhattan |
-1.00% |
|
Station |
Borough |
Median Decline, |
|
Flushing-Main St |
Queens |
-2.4% |
|
Fulton Street |
Manhattan |
-2.0% |
|
Broadway/Jackson Heights |
Queens |
-2.0% |
|
Chambers St/WTC |
Manhattan |
-1.9% |
|
Penn Station |
Manhattan |
-1.8% |
|
Atlantic Av-Barclays Center |
Brooklyn |
-1.8% |
|
Times Square |
Manhattan |
-1.7% |
|
Grand Central |
Manhattan |
-1.1% |
|
Union Square |
Manhattan |
-1.0% |

Joseph Chow
