

NYU Tandon Study Finds City-Level Fire Data Can Hide What's Happening Block by Block
A decade of FDNY data, analyzed tract by tract, shows why zooming out to citywide averages can miss where fire risk is actually changing.
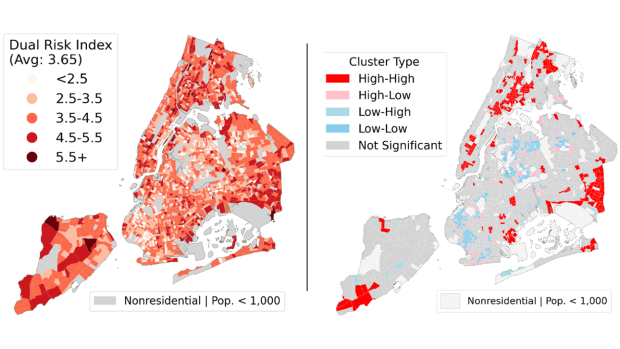
NYU Tandon researchers' Dual Risk Index maps New York City's structural fire risk by census tract, combining fire frequency and FDNY response time (left). Darker shades indicate higher risk. High-risk clusters appear in Manhattan, the Bronx, and the city's periphery, while central Brooklyn and Queens score lowest. The right map confirms these clusters are statistically significant, not isolated tracts.
Image Source: (Bonestroo & Augustin, 2026)
A decade of New York City fire data shows that citywide trends can mask sharply different realities on the ground, with some neighborhoods moving in the opposite direction of the city as a whole.
A new study published in the Fire Safety Journal breaks down more than 411,000 structural fire incidents recorded by the FDNY between 2013 and 2023 across roughly 2,200 census tracts, small statistical subdivisions of a few thousand residents each, rather than the borough- or citywide figures typically used to track fire trends.
Hannah Bonestroo, a Ph.D. student in Urban Systems at NYU Tandon School of Engineering, conducted the research with Assistant Professor Augustin Guibaud, a faculty member of the Department of Mechanical and Aerospace Engineering affiliated with the NYU Tandon’s Center for Urban Science + Progress.
"If the city is looking at inequalities at the neighborhood scale, or allocating resources at the neighborhood scale, there may be areas with different patterns that get missed," said Bonestroo.
At the citywide level, the story looked simple. Structural fires fell 11.3 percent over the decade, a clear improvement. But that average hid real variation underneath it.
"If you look much more granularly at the census tract level, there were hot spots, areas where fires were actually increasing over the ten years,” said Bonestroo. Eastern Queens and Staten Island were among the places moving against the citywide trend.
Response time showed a different pattern entirely, forming large clusters of similar trends across the city rather than concentrating in pockets. Average response time rose 30 seconds over the decade, from 4 minutes 6 seconds to 4 minutes 36 seconds, now exceeding the National Fire Protection Association's 4-minute travel-time standard.
"In a fire, every second counts," said Guibaud. "Thirty seconds may not sound like much, but it can be enough time for a fire to intensify and for smoke to fill a space, and the first crew on scene can arrive to a situation that's already beyond what they can handle."
"Almost the entire city is following the pattern of it increasing," Bonestroo said, a contrast to fire frequency, which varied sharply block to block. Northwestern Queens saw the sharpest deterioration in response time over the decade.
Recent reviews by the FDNY and the New York State Senate have pointed to traffic congestion and rising call volume – the department responds to more than a million emergency calls a year – rather than neighborhood demographics or distance from firehouses. The researchers' analysis agrees, as fixed socioeconomic and built-environment factors explained only about a quarter of the differences in response time between tracts.
That contrast pointed to a second finding. Fire frequency and response time capture largely different dimensions of risk. Areas with the most fires tended to have faster response times, not slower, something Bonestroo reads as reassuring rather than puzzling.
"That's a good indicator that FDNY has placed its resources where the fires are," Bonestroo said.
Because the two measures move independently, Bonestroo and Guibaud built a Dual Risk Index, designed to catch tracts that don't top the list on fire count or response time individually, but rank high on both at once. To put it simple, fire frequency reflects the likelihood of a fire. Response time shapes how bad it can get once one starts. The index multiplies the two.
"If you just looked at the top 50 tracts by number of fires, you might miss a tract that has a fairly high number of fires and fairly slow response time, just not the highest number and the slowest time," Bonestroo said. "That's the kind of area the index is meant to catch."
Mapped across the city, high dual-risk areas cluster in Manhattan, the Bronx, and at the city's periphery, while central Brooklyn and Queens score lowest.
Tested against the locations of multi-alarm fires, the most severe incidents, over the decade, the index performed modestly better than either individual measure at flagging high-priority tracts. None of the measures, including the index, strongly pinpointed where the city's most severe fires occurred.
"It showed that it did capture more, but it wasn't statistically significant once you account for the confidence intervals," Bonestroo said.
The researchers say that shows the need for better public data on fire outcomes. "The paper isn't meant to tell FDNY where they need to reallocate resources," Bonestroo added. "Rather, it’s meant to reveal neighborhoods that may not be following overall citywide trends and are worthy of further inquiry to understand why." The index is a starting point, as the researchers plan to test other ways of accounting for other factors such as overall building safety records.
The analysis relies entirely on public data: FDNY's Fire Incident Dispatch Data and NYFIRS, the federal NFIRS system (replaced by a new national reporting system, NERIS, in February 2026), the Mayor's Management Report, and U.S. Census Bureau estimates. “Unfortunately, these sources vary in their reporting, even though records are meant to pass between the systems unchanged, so even the most basic count depends on which record you consulted” said Guibaud.
For 2023, the city's official tally in the Mayor's Management Report lists 35,567 fires, against 30,301 for the federal NFIRS database records, some 5,300 fewer. Individual incidents were sometimes classified differently from one dataset to the next, and Bonestroo carefully mapped the discrepancy by identifying where individual fire event landed in each database.
Bonestroo received a Sheldon Tieszen Student Award in June 2026 at the International Symposium on Fire Safety Science in La Rochelle, France, for the paper.
Bonestroo, H., & Augustin, G. (2026). Structural fires and emergency response in New York City: A spatiotemporal analysis of fire incidence and severity. Fire Safety Journal, 162, 104718. https://doi.org/10.1016/j.firesaf.2026.104718

Hannah Bonestroo