Urban Spatial Analytics — Spring 2024
Explore student work showcasing GIS concepts through interactive maps and data visualizations using ArcGIS StoryMaps.

Overview
During the Spring 2024 semester, students in the Urban Spatial Analytics course (CUSP-GX 8033) led by Industry Assistant Professor Anton Rozhkov completed eight ArcGIS Storymaps reports. The work featured below was produced by Jiyun Cho, Koyel Das, Ruixin Gan, Qianyong Hu, Godfried J.S. Matahelemual, Sonali Mhatre, Akanksha Patil, Ismail Rashad, Feiyang Ren, Vinayak Saxena, Swati Sharma, Emanuel Simmons, Satyajit Sriram, Paul Wennberg, Hongying Wu, Yuntian Wu, Zhiyi Xie, Xueliang Yang, Wujun Zhou.
During the latter part of the semester, students applied both foundational and advanced GIS techniques to address urban challenges. Over several weeks, they developed research questions and explored selected topics using spatial analysis to create meaningful solutions. The students were encouraged and equipped to utilize a range of advanced GIS tools and analytical techniques, including spatial statistics, 3D mapping, Python for GIS, network analysis, and spatial modeling. The course also emphasized effective data management practices, including the use of geodatabases and web-based data services like the NYC Open Data Portal and U.S. Census Bureau.
The students' work culminated in ArcGIS Storymaps reports, where they used advanced mapping techniques and supplementary data to clearly illustrate their methodologies and effectively communicate their findings. These projects reflect the course’s emphasis on integrating spatial analysis with data modeling, visualization, and problem-solving in various fields such as urban planning, transportation, sustainability, public health, and more. The students' dedication and hard work throughout the semester are greatly appreciated, as they have demonstrated a deep understanding of GIS and its application to complex, real-world problems.
Strategic Expansion of Renewable Energy Infrastructure
Authors: Paul Wennberg, Ismail Rashad, and Godfried J.S. Matahelemual
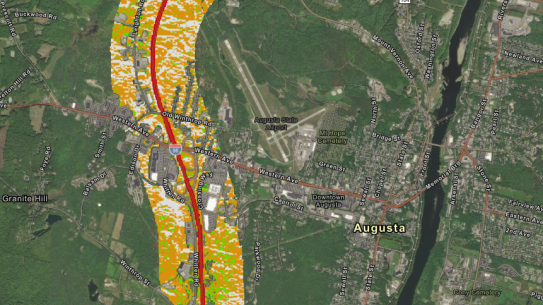
This study, Strategic Expansion of Renewable Energy Infrastructure along the I-95 Corridor in Maine explores the potential of using area along Maine’s I-95 corridor for installing solar arrays. These areas, often underdeveloped, are examined for land suitability and solar radiation, and through planning scenarios to balance energy optimization with community impact. Starting with broad location scenario of a 500-meter buffer around I-95 progressively narrowed down to I-95 Right-of-Way (RoW) land, we identified four separate scenarios for robust solar panel development in the state of Maine. This project both calculates the estimation of electricity that can be produced state-wide to a detailed project-scale evaluation based on specific landscape features within the RoW. This project also explores site selection options for Maine’s battery storage facilities to meet its 2030 and 2050 goals. This detailed analysis helps calculate the potential energy production from solar installations. It demonstrates that there are viable sites surrounding i95 in southern Maine (from a 500-meter buffer down to solely the rows) for solar energy production. we limited our study to the portion of the highway south of Augusta due to the sheer size of the data to be processed. This would go a long way in meeting Maine’s 2030 electricity goals and create a new revenue stream for state departments of transportation.
Evaluating Urban Mobility in Brooklyn
Authors: Jiyun Cho, Hongying Wu, and Emanuel Simmons
This project, Evaluating Urban Mobility in Brooklyn: The Impact of EV Charging Infrastructure and Public Transportation Accessibility on sustainable transportation aims to assess the usage of various sustainable transportation modes such as electric vehicles, public transit, and New York’s bike-sharing system, Citi Bike, within New York City, and analyze how they support the community using ArcGIS Pro. Through this analysis, we will explore which areas are utilizing sustainable transportation least effectively and how the accessibility of these modes correlates with race, income levels, or population density. The goal of this project is to understand how New York City's diverse transportation policies and specific implementation plans interact with environmental and economic factors in different areas. The analysis provides a clear overview of the status of sustainable transportation infrastructure and offer data that can inform the development of effective future policies.
Inclusive Transit: Assessing Universal Design in Subways
Authors: Akanksha Patil, Koyel Das, and Vinayak Saxena
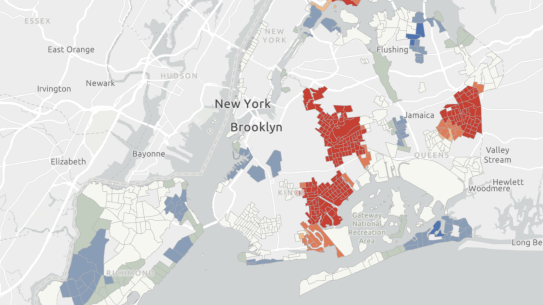
New York City's public transportation system is vital, serving 6.1 million daily riders and facilitating access to work, education, social engagements, and healthcare. Accessibility is crucial for tackling socioeconomic inequalities. In New York, individuals with disabilities face significant poverty rates, with over 36.5% living below the poverty line. A lack of transportation options is one of the most significant barriers to employment for New Yorkers with disabilities. This arises the issue of transit deserts — areas with fewer nearby accessible stations. The research answers the question: how does the spatial distribution of inaccessible subway stations in New York City impact the mobility and socioeconomic opportunities of individuals with disabilities, and which stations should be prioritized for accessibility improvements to maximize benefits for this population?
Forecasting NYC Crime Incidents and Security Optimization
Authors: Wujun Zhou and Qianyong Hu
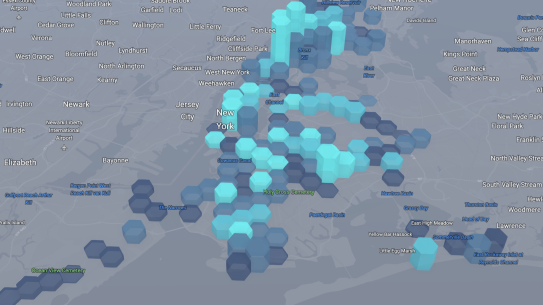
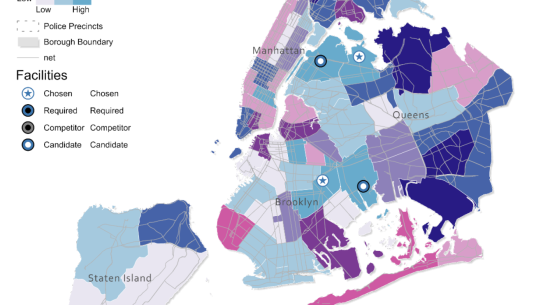
In recent years, various types of crime in New York City (NYC) have been on the rise (Baumer & Wolff, 2020). The high incidence of crime not only threatens the safety of citizens’ lives and property, but also hinders NYC’s social order and economic development. Based on the above environment, how to effectively identify crime hotspots in NYC, analyze the strengths and weaknesses of local police agencies, and plan and establish new police stations have become major issues that the local planning department of NYC needs to solve urgently. Through the analysis and discussion of these issues, this project aims to provide scientific ideas and suggestions for solving the crime problem in New York City, and at the same time demonstrate the important role and application prospects of GIS technology in the research and governance of social issues.
Locating the closest restroom in NYC
Authors: Satyajit Sriram and Sonali Mhatre
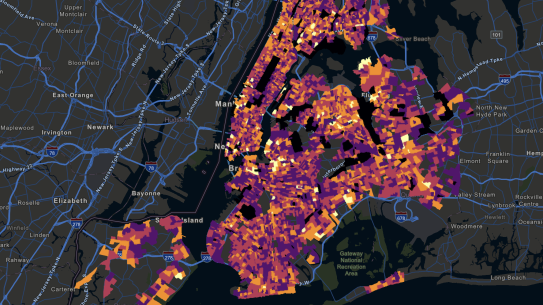
Finding a public bathroom in New York City (NYC) is challenging, compared to most other cities in the country. This study addresses the challenge of restroom accessibility in NYC by analyzing the distribution of publicly available bathrooms and their proximity to urban areas. The goal is to ensure that an accessible bathroom is within a 3–15-minute walk from any location in the city. Using Geographic Information Systems (GIS) tools, we identify hot-spots and cold-spots of restroom availability and investigate the relationship between restroom accessibility. There are fewer than 1,200 public bathrooms for the city’s 8.4 million residents and millions of tourists, according to the non-profit Urban Design Forum. The research question is: can people in NYC use restrooms on-the-go?
NYC transit accessibility analysis
Authors: Zhiyi Xie and Yuntian Wu
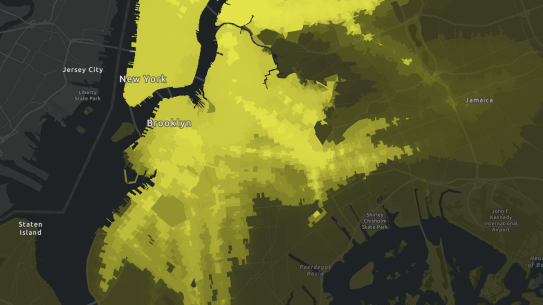
In New York City, the subway system is crucial for millions, supporting daily commutes and influencing urban mobility. This project uses Geographic Information Systems (GIS) for a detailed analysis of NYC subway coverage, examining how well the system meets urban demographics and accessibility needs. The study highlights transit equity gaps and sustainable development opportunities, incorporating theories of accessibility and land-use interaction that link transit accessibility disparities to socioeconomic and demographic factors (Levinson & Krizek, 2018; Martens, 2016; El-Geneidy et al., 2016). Previous research has documented the crucial role of GIS in identifying and addressing transit deserts—areas with significant transit demand but insufficient service. Studies have shown that these areas often coincide with neighborhoods housing marginalized populations, exacerbating social and economic inequities (Levinson et al., 2015). Furthermore, GIS-based studies contribute to a nuanced understanding of transit accessibility by mapping service distribution and integrating this data with demographic analytics, thus providing a robust framework for policy development aimed at enhancing transit equity (Geurs & Van Wee, 2004; Fan et al., 2016). The primary goal of this project is to provide a comprehensive analysis of transit accessibility in New York City, using spatial and demographic data to illuminate areas of concern and opportunities for enhancement.
Urban Park Mobility Analysis
Authors: Feiyang Ren, Ruixin Gan, and Xueliang Yang
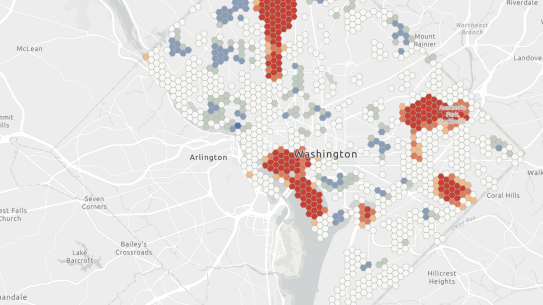
Parks and green spaces are highly valued urban destinations, enhancing the quality of life for city residents (El Murr, Boisjoly, & Waygood, 2023). These spaces contribute significantly to well-being (El Murr, Boisjoly, & Waygood, 2023), environmental health (Haase et al., 2014), social cohesion (Peters, Elands, & Buijs, 2010), and economic prosperity (Hoshino & Kuriyama, 2010). Consequently, accessibility to parks and green spaces is considered a crucial component of life quality (Cracu, Schvab, Prefac, Popescu, & Sîrodoev, 2024). Ensuring equitable access to these areas is essential for fostering inclusive urban environments. The accessibility of urban greenspaces is an increasing concern (Comber, Brunsdon, & Green, 2008). Addressing such disparities is crucial for achieving equitable urban development. This project employs the GIS tools described previously to evaluate park accessibility in New York City, Boston, and Washington DC. Building on the hypothesis that densely populated blocks tend to cluster near parks, the analysis will define service areas for each city. This approach facilitates a detailed comparison of the effectiveness with which these urban environments provide their residents access to green spaces. This comparative study highlights variations in park accessibility and its correlation with population density, thereby providing insights into urban planning and the distribution of recreational areas.
Women’s Safety in Urban Transit Last Mile Connectivity
Author: Swati Sharma
In 2015, The GDELT Project mapped Violence Against Women across the world. Each dot on the map represents a location with at least 25 articles discussing violence against women or sexual violence from February 2015 through October 17, 2016. There is a significant relationship between urban conditions, crime incidents, and the safety of women's walkability in NYC. Areas with higher incidents of crime, coupled with factors such as poor lighting, inadequate infrastructure, and sanitation issues, are likely to be associated with lower safety scores for women's walking routes. This project seeks to explore and raise awareness about the unique safety challenges women face in mobility, advocating for spaces where they can move freely and confidently without the constant burden of fear. Through examining this phenomenon, this project aims to spark conversations and initiatives that promote safer urban environments for all and answer the research question: how can urban factors and crime incidents be analyzed to enhance the safety of women's walkability in New York City?
