
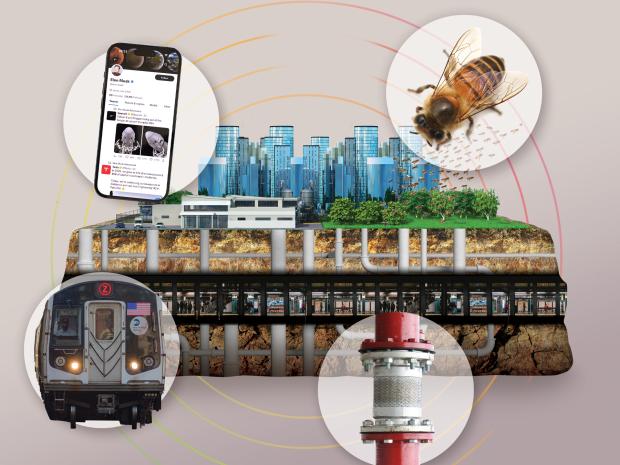
New Ways to View Your City
Next time you go for a stroll through your neighborhood, take a moment to take in your surroundings. Observe the trees and buildings, hear conversations or children playing, feel the vibrations caused by cars, smell the (hopefully pleasant) smells. There’s a lot we can learn about a place just by being in it.
But maybe you want to dig a little deeper. You could go online to view building records, zoning permits, or sewage infrastructure. You can read the history of the area, read about it’s ecology, and plenty more. But here at NYU Tandon, we’re looking at your neighborhoods in a new, askew way — perspectives you may never have considered.
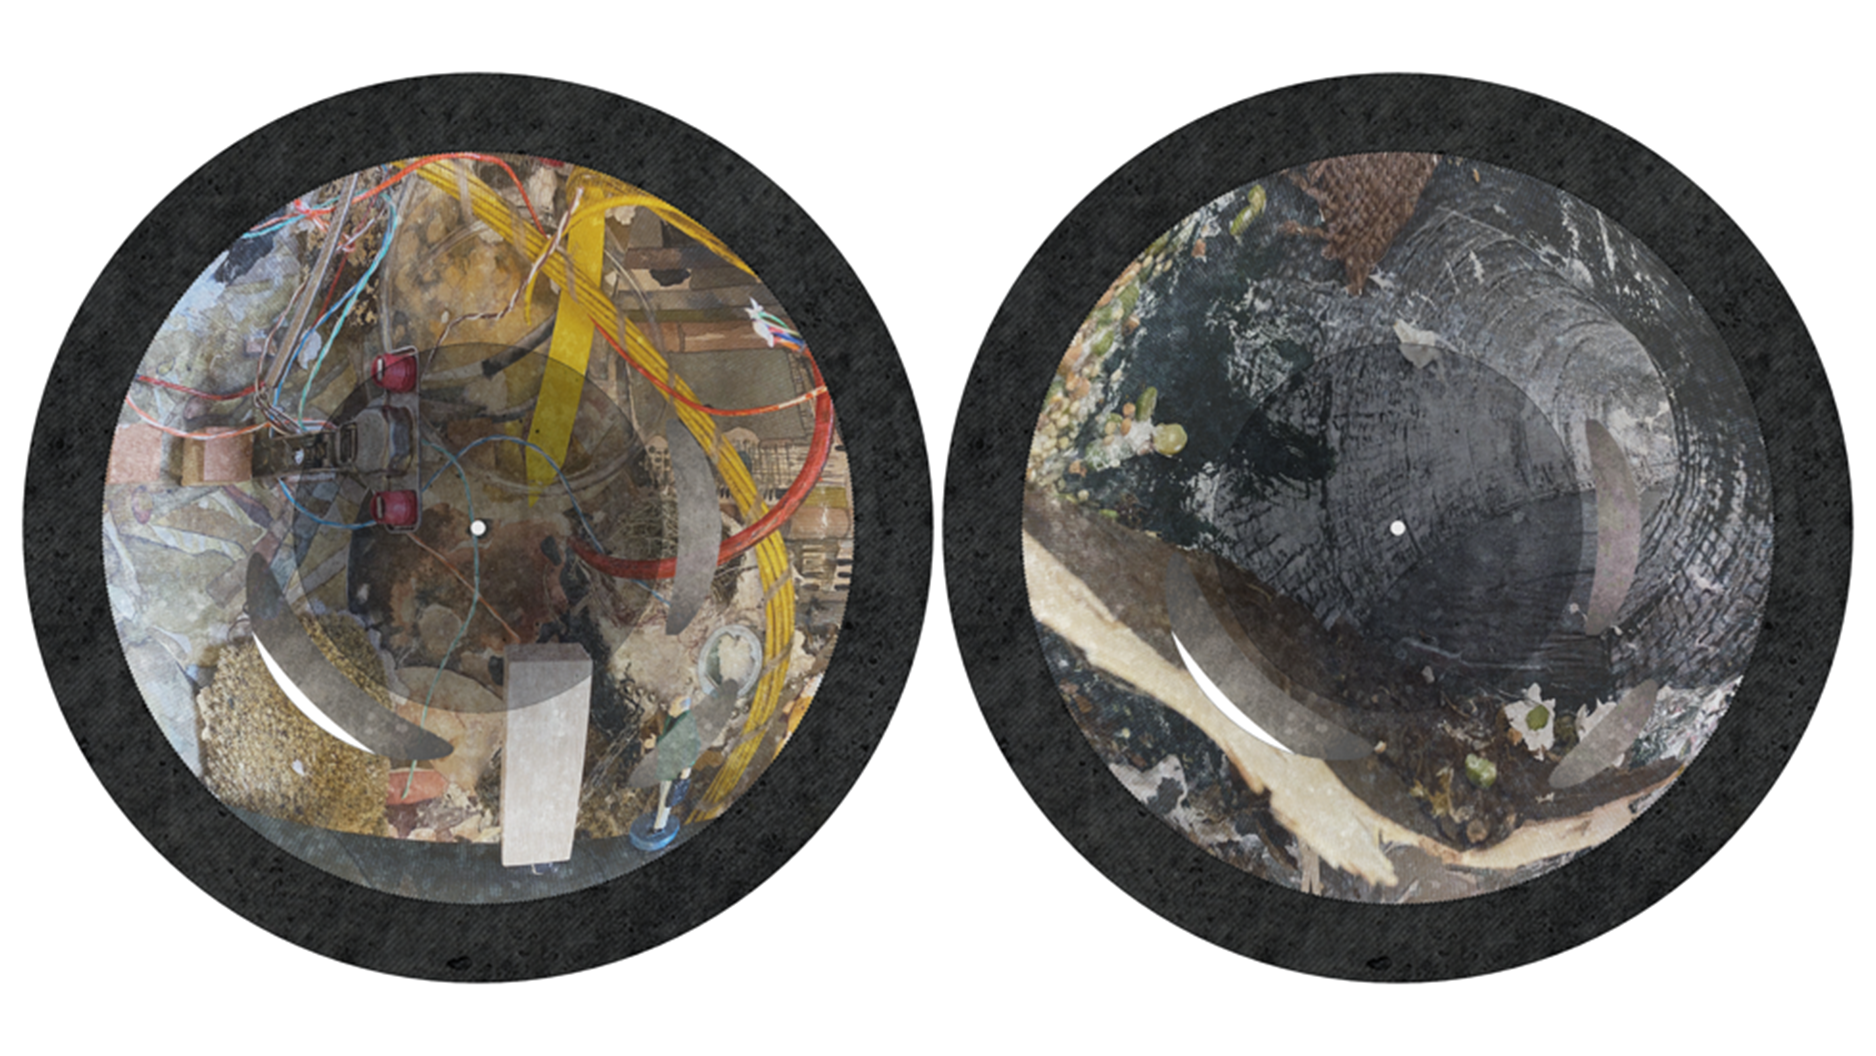
The “subsurface spaghetti” of city infrastructure
Extreme events caused by climate change, weather, and accidents can seriously affect the infrastructure we rely on, and that includes everything underground. In a dense urban environment like New York City, water and sewer networks, electricity, and transportation systems form an incredibly complex underground network of interlocking systems — like a pile of spaghetti on a plate.
Because this underground infrastructure is so interconnected, when something goes wrong, it can cause a domino effect, impacting things like power, water supply, transportation, and communication, which can have significant social and economic consequences for residents.

To deal with these challenges and make communities more resilient, Debra Laefer, Professor of Civil, Urban and Environmental Engineering and a member of CUSP, is working on a project called UNUM: Unification for Underground Resilience Measures. The project will work with utility companies, city agencies and consultants to design a roadmap for city-level implementation of a subsurface data model and assemble two pilot data sets to prepare study sites against natural disasters. The goal is to create a common understanding of the underground infrastructure and develop strategies to handle disasters and threats like sea-level rise.
The project is being piloted in two areas of New York City: Midtown East (Manhattan) and Sunset Park (Brooklyn), which have different underground conditions and diverse populations.
In the first stage of the project, over 40 stakeholders agreed to share their data through a repository managed by the city agency. Now, in the second stage, they are standardizing the data to make it compatible with each other and integrate it onto a common map for better analysis.
By doing this, they hope to identify vulnerabilities, reduce accidents and emergencies, and strengthen the infrastructure to withstand natural disasters and other large-scale threats.
Illuminating the subway
For the blind and visually impaired, navigating the complex network of tunnels, ticket kiosks, and platforms of a subway stop can produce a lot of anxiety and frustration. Because subway signs are typically graphical or text-based, they are especially difficult to recognize from distances and reduces the ability to be autonomous in unfamiliar environments. But thanks to a new app from NYU Tandon researchers, that frustration may be alleviated in New York City.

Developed by John-Ross Rizzo, Associate Professor of Mechanical & Aerospace Engineering and Biomedical Engineering, as well as a member of NYU WIRELESS and CUSP, and a team that includes advisors from New York City’s Metropolitan Transit Authority (MTA), Commute Booster automatically figures out what signs a traveler will encounter along the way to a specific subway platform. Then, it uses a smartphone’s camera to recognize and interpret signs posted inside transit hubs, ignoring irrelevant ones and prompting users to follow relevant ones only.
In a recent study, researchers tested Commute Booster’s interpretation of signage from three New York City subway stations — Jay Street-Metrotech, Dekalb Avenue and Canal Street — that a traveler would encounter on a specific journey. The app proved 97 percent accurate in identifying signs relevant to reach the intended destination.
Testing inside those three subway stations also revealed that Commute Booster could “read” signs from distances and at angles that reflect expected physical positioning of travelers.
The Commute Booster system relies on two technological components. The first, general transit feed specification (GTFS), is a standardized way for public transportation agencies to share their transit data with developers and third-party applications. The second, optical character recognition (OCR), is technology that can translate images of text into actual editable text. These two technologies, when used in tandem with Commute Booster’s algorithm, can identify relevant navigation signs and locate the position of signs in the immediate environments.
New York City’s subway system has long had issues with accessibility, and Commute Booster is just one example of how technology can improve the outlook for people in the city who otherwise might struggle with tasks we take for granted.
The future of flooding
FloodNet, the first-ever New York City flood-monitoring network, received $7.2 million in city funding that will greatly increase the number of monitored flood-prone locations from 31 to 500 over the next five years.
The project uses sensors installed in flood-prone areas of the city, and can give several hours of advanced warning as water levels begin to rise.
In addition to the sensor network, FloodNet also provides a free, mobile-friendly web dashboard that allows New York City residents and other stakeholders to monitor and react to flood threats in real-time. Launched on the one-year anniversary of Hurricane Ida, the dashboard displays data collected by FloodNet’s expanding system of low-cost, open-source sensors across the city’s five boroughs.
FloodNet — made possible with financial support from the C2SMART Tier 1 U.S. DOT Center at NYU Tandon, the NYU Marron Institute, and the CUNY Office of Research — was developed and tested over the past two and a half years by a group of environmental researchers from NYU Tandon and a number of other schools, and in partnership with the NYC Mayor’s Office of Climate & Environmental Justice, the NYC Office of Technology & Innovation, and neighborhood community groups.
Racism, homophobia, mental health ... and Twitter
Twitter (now known as X) may hold a key to pinpointing precise neighborhoods where systemic racism and homophobia have taken hold, allowing researchers to measure the mental-health impact on diverse groups of people who spend time in those places.

A team led by Rumi Chunara, Associate Professor of Computer Science and Engineering as well as NYU School of Public Health’s Biostatistics Department, divided up all of New York City into more than 200 geographic clusters — discrete areas, in some cases just multiple blocks — defined by the degree of racism and homophobia within each of those locations.
Unlike typical sources of demographic data, Chunara and her colleagues used Twitter as a proxy to measure nuanced “on the ground” negative sentiment that can permeate the cultural climate of specific locations.
The complex analysis required the team to develop and employ a novel technique called socio-spatial self-organizing maps (SS-SOMs), in which they applied a combination of keyword filtering, labeling, and iterative learning to Twitter posts generated in New York City. With the resulting data, they drew boundaries around small areas based on the similar racial and sexual-orientation attitudes expressed in the postings.
For this project, the team built on that existing research by recruiting 147 young Black, white and Hispanic men in New York City who identify as gay or bisexual, to wear GPS tracking devices for a two-week period. The participants self-reported their mental health during that time, accounting for feelings like stress or depression.
All three data sources — Twitter sentiment, GPS tracking and self-reported mental health status — gave researchers the ingredients for a regression analysis that investigated how spending time in places with negative attitudes about race or sexual orientation affected the men’s mental well-being. Researchers also looked at whether the participant’s race or ethnicity affected this relationship.
Structural racism and homophobia have been uniquely challenging to measure scientifically, and thus understanding their effects on health has been difficult. This type of Twitter data provides a foundation on which we can then research nuanced questions about the impact of placed-based negative sentiment in people’s lives."
Mapping microbiomes with honeybees
Honeybees foraging in urban environments could provide valuable information about the communities of fungi and bacteria that exist there, some of which impact people’s health and well-being, a study published in Environmental Microbiome suggests.
Analyzing these complex groups of microorganisms — known as microbiomes — can require teams of volunteers to gather samples, a prohibitively time- and labor-intensive process. Honeybees, because they forage daily in a two-mile radius of their hives, provide an alternative method of sample collection that can, ultimately, allow researchers to create a microbial map of a city far more efficiently.

Elizabeth Hénaff, Assistant Professor in NYU Tandon’s Center for Urban Science and Progress (CUSP) and in the Department of Technology, Culture and Society, conducted a pilot study by sampling various materials from three hives in the New York City boroughs of Brooklyn and Queens. She found diverse genetic information in the debris accumulated at the bottom of the hives, including genetic data from environmental bacteria.
The study finds that hive debris analysis may also offer a way to surveil human pathogens in big cities. The researchers uncovered genetic material in the debris for the pathogen Rickettsia felis, which causes cat scratch fever in people.
Further sampling of hive debris in Sydney, Melbourne, Venice, and Tokyo, revealed that each neighborhood and city has a unique genetic signature as seen by honeybees.
The genetic data from Venice was dominated by fungi related to wood rot and date palm DNA, while Melbourne’s sample was dominated by Eucalyptus DNA. The sample from Sydney contained genetic data from a bacteria species that degrades rubber, and Tokyo samples included plant DNA from Lotus and wild soybean, as well as the soy sauce fermenting yeast Zygosaccharomyces rouxii.
So next time a honeybee lands next to you, consider what it may know before you shoo it away.