
What the World Cup Taught Us About Crowd Movement
New research from NYU Tandon's C2SMART center show that planning and infrastructure, not attendance size, predict congestion.
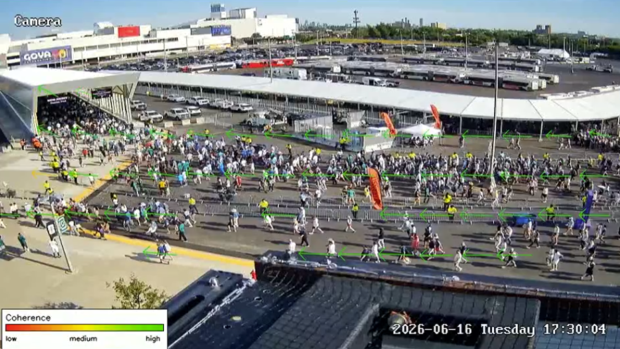
Example output from the computer-vision system for characterizing aggregate pedestrian movement at the event venue, with green overlays indicating detected motion cells. Source: NYU C2SMART
While common wisdom holds that bigger crowds mean worse congestion at large events, the reality is more complex.
Infrastructure improvements and event-specific operations can make even mega-event pedestrian congestion manageable, according to data collected at MetLife Stadium during all eight 2026 World Cup matchdays and from 14 other major events the stadium hosted in 2025.
NYU Tandon's C2SMART transportation research center deployed AI-powered cameras that processed anonymized crowd movement data in real time at the facility beginning last year. The team conducted the work in partnership with the New Jersey Sports and Exposition Authority (NJSEA), MetLife Stadium, and AIWaysion, a University of Washington spin-off specializing in smart transportation technology.
The most striking finding came on July 19, when more than 80,000 fans poured out of MetLife Stadium after the World Cup final. Despite the scale, scores on a standardized congestion index (a scale of 0 to 100, where 100 represents the highest congestion level recorded at the venue in 2025-2026) were lower than those recorded at WWE events drawing fewer than 61,000.
The difference was the coordinated crowd-management operations and a new pedestrian bridge, completed just ahead of the tournament, that gave the crowd a second route out. For three non-final matches, pedestrian peak congestion ran 16 to 28 percent below the pre-tournament benchmark.
"From the outset, the Authority recognized that the success of this event depended on early planning, clear goals, and strong coordination between the public and private sectors,” said Jill Hirsch, the President & CEO of NJSEA. “This collaboration strengthened communication, streamlined operations, and ensured the safe and efficient movement of spectators."
Even the final, complicated by a trophy presentation that delayed the main departure wave by more than an hour, came in 5 percent below the pre-tournament benchmark, and 20 percent below the highest congestion level observed across all monitored events in 2025–2026.
"Attendance tells us how many people are coming, but it does not tell us how that particular crowd will move," said Kaan Ozbay, Founding Director of C2SMART and the project's principal investigator. "Our main research contribution is to be able to quantify the factors around the attendee count using AI-based cameras and a customized video processing algorithm. This includes pre-event programming, arrival patterns, how fans move, when they leave, and turning all of these into actionable event intelligence."
Crowd dynamics also varied by day of the week and time of day. Game outcomes shaped egress patterns too. Lopsided scores triggered early departures, while close games produced a sharp, synchronized surge at the final whistle.
That pattern held during the World Cup on matchdays where decisive leads developed before the final whistle. In France vs. Sweden and Panama vs. England, early departures were measurably higher, accounting for an average of 12% of the total, compared with an average of 4% on June 13 and June 16, when matches remained competitive until the end.
The July 19 final produced two distinct congestion waves rather than one, the second peaking approximately 75 minutes after the game ended as fans remained for the presentation ceremony and trophy lift, a staggered pattern that proved more manageable, even if not necessarily easier, than one simultaneous wave.
"What surprised us most was the same stadium became a different transportation system from one event to the next," said Jingqin Gao, Assistant Director of Research at C2SMART and the project's co-principal investigator. “WWE daytime fan events at American Dream, the nearby entertainment and retail complex, may have concentrated post-event foot traffic near the pedestrian bridge, while World Cup matches saw almost no late arrivals, compared with about 12% at other events at the Metlife Stadium. ”
World Cup fans ran on a different clock. They arrived substantially earlier than other types of events that happened at the same venue. Across non-final matches, half of fans had gotten off NJ Transit trains or shuttle buses between one hour 50 minutes and two hours 25 minutes before kickoff, with weekend arrivals coming roughly 25 minutes earlier than weekday ones.
Through a collaborative NJ Transit and NJSEA effort, we analyzed past travel patterns and implemented a Transit Signal Priority system over the NJSEA Meadowlands Adaptive Signal System for Traffic Reduction (MASSTR),” said Nadereh Moini, NJSEA Chief of Transportation & Transportation Safety. “This prioritized NJ Transit bus platoons, ensuring speedy travel between Secaucus Junction and the Stadium.”
Pedestrian bridge users arrived later still, with nearly one in five crossing during the final hour before kickoff compared with one in ten at the rail area.
The analysis is retrospective, but its value is forward-looking, researchers said. Each event adds to an evidence base that agencies and venue operators can use to prepare for future ones, planning for behavior-driven variability, not just attendance, and building in flexible layouts like adaptive fencing and dynamic signage to respond quickly to emerging bottlenecks.
"The AIWaysion edge AI vision platform enabled remote sensing of crowd and traffic dynamics while also allowing us to stress-test cellular communication performance during large events," said Wei Sun, co-founder and CEO of AIWaysion.
The system can provide continuous operational information for events at the Meadowlands well beyond the World Cup, the research team said, and the methods, algorithms, and lessons learned could be adopted by other venues, including the 2028 Los Angeles Olympics.
This study builds on research initially funded by the SEMPACT Center through the U.S. Department of Transportation's University Transportation Centers (UTC) Program. The findings are those of the research team and do not necessarily represent the views of NJSEA, MetLife Stadium, or the U.S. Department of Transportation.