Speaker:
David Fenyö, PhD
Professor, Department of Biochemistry and Molecular Pharmacology
Institute for Systems Genetics, NYU Grossman School of Medicine
Abstract:
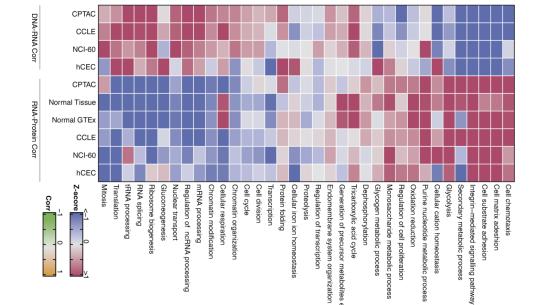
Advances in sequencing technologies have revealed large heterogeneity on the genome and transcriptome level in tumors. However, it has often been difficult to pinpoint which of the changes are important drivers of tumor growth. Proteomic technologies measuring the functional gene products directly have also improved rapidly, and they provide rich complementary information. The combined application of proteomics and genomics to the understanding of tumor biology has the potential of driving innovative diagnostics and new treatments for cancer. Dr. Fenyo will discuss proteogenomic integration and how we can use it to better understand tumor biology.
Dr. Fenyö studied engineering physics, with a focus on mathematical and numerical methods, at Uppsala University in Sweden. There he received a Ph.D. in Physics in 1991, after which he joined the laboratory of Dr. Brian Chait at the Rockefeller University. In 1997 he co-founded ProteoMetrics, a bioinformatics startup that sought to commercialize these algorithms. Subsequently he accepted a position as Director of Proteomics at Genomic Solutions, and as Staff Scientist and Product Manager at Amersham Biosciences and GE Healthcare before returning to academia. Currently, he serves as the Interim Director for the Center for Health Informatics and Bioinformatics at NYU Langone Medical Center, Director for the Biomedical Informatics Shared Resource at the Cancer Institute, Co-Director for the Biomedical Informatics Core at the Clinical and Translational Science Institute, and Graduate Director for the Ph.D. program in biomedical informatics. Over his career Dr. Fenyo developed search engines that identify proteins by matching mass spectrometric and sequence data, and built commercial software packages for fully automated high-throughput identification and quantitation of proteins. He has more than 100 scientific publications in these areas.


