Towards Improved Health via Computational Precision Medicine: Learning from Heterogeneous COVID Data
Speaker:
Farah E. Shamout
Assistant Professor & Emerging Scholar of Computer Engineering
NYU Abu Dhabi
Abstract:
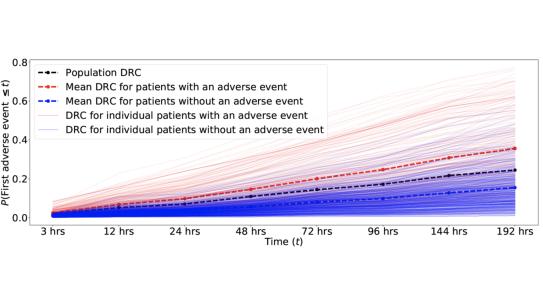
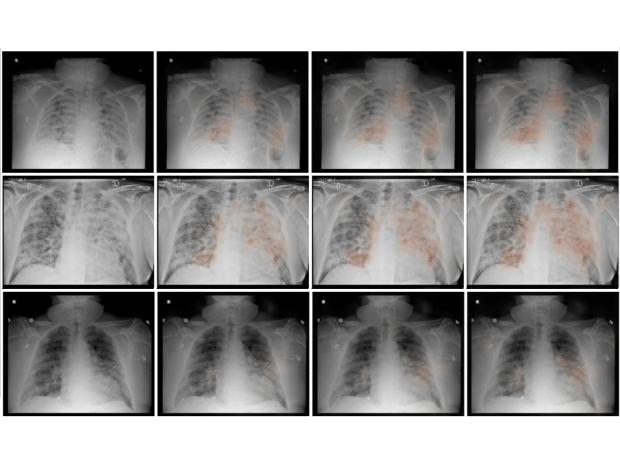
In the era of big data and artificial intelligence, computational precision medicine can create opportunities that directly contribute to saving patient lives, improving efficiencies of care providers, and decreasing the high burden of disease and socioeconomic costs. In this talk, Dr. Shamout will provide a high-level overview of the state-of-the-art and recent work on machine learning for healthcare. The focus will be on two flagship projects that were completed during her appointment as an Emerging Scholar at NYU Abu Dhabi, which included (i) deterioration prediction among COVID-19 patients and (ii) breast cancer detection in ultrasound imaging. Finally, she will describe the themes of ongoing work and aims of future plans, in order to advance patient diagnosis and prognosis and promote multidisciplinary contributions in computing and health sciences at NYU.
Dr. Shamout is an Assistant Professor Emerging Scholar in Computer Engineering at NYU Abu Dhabi, where she leads the Clinical Artificial Intelligence Laboratory. She is also an Affiliated Faculty in the Radiology Department at NYU Grossman School of Medicine. Prior to joining NYU Abu Dhabi, Farah completed her DPhil (PhD) in Engineering Science at the University of Oxford as a Rhodes Scholar and was a member of Balliol College. Her research interests lie in using data science and machine learning for real-world clinical problems, multi-modal learning, and mining of electronic health records