2014 SMARTER Program Project Archive
Project 1: Energy Consumption Rate in a DC Motor
Teachers: Prasad Akavoor and Yancey Quiñones, Mentor: Dr. Joo Kim, Research Collaborator: Henry Clever and Dustyn Roberts
Research
Title: Energy Consumption Rate in a DC Motor
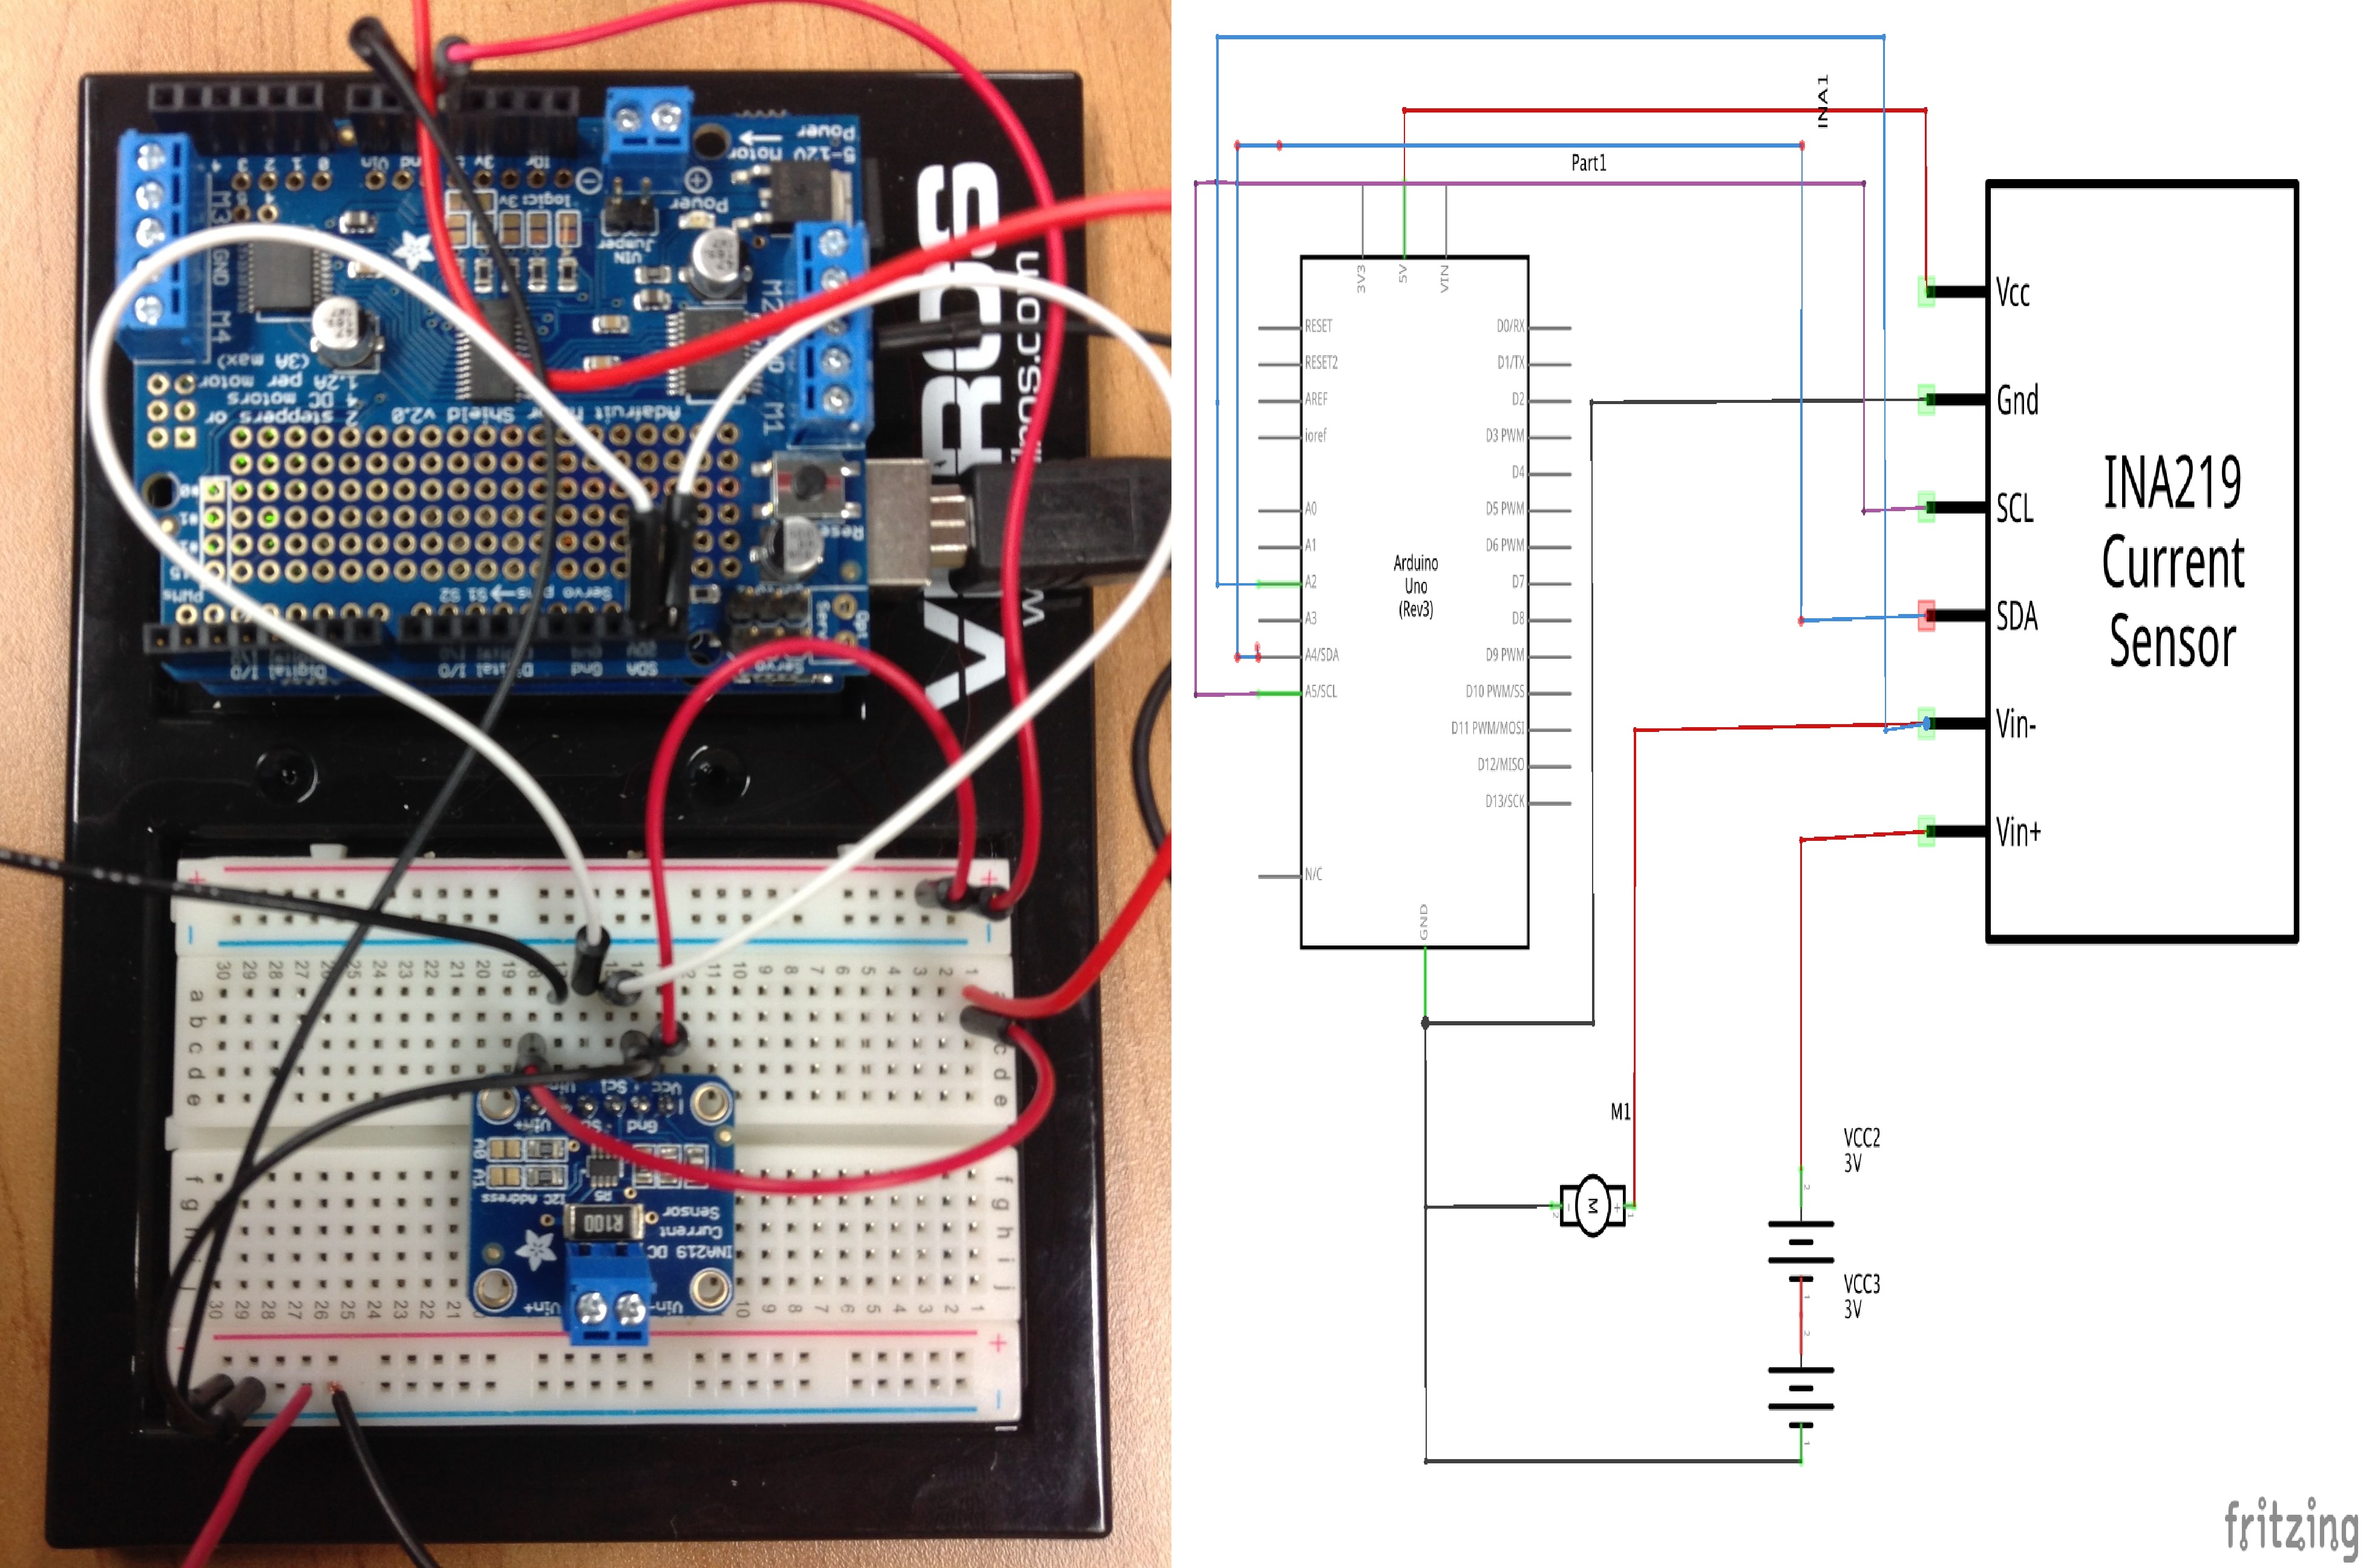
How mechanical work affects the performance of and energy consumption rate in a motor—attached to a robot for example—is an ongoing engineering question. It is well understood that negative mechanical work done on a motor would increase the current through the motor and decrease the voltage across it. As a result, the energy consumption in the motor would increase. To understand this phenomenon, consider a circuit where a motor is connected to a battery of voltage V and draws a certain current I. The power consumed would be the product V×I. The motor draws less current when there is no mechanical load than when a negative mechanical work is done on the motor. This is because the motor runs faster without the load and therefore a significant amount of back electromotive force (EMF) builds up, and this back EMF sends a current opposing the current supplied by the battery, thus reducing the total current going through the motor. However, when a mechanical load is added to the motor or when the motor is forced to slow down by an external force, then the back EMF is smaller and therefore the circuit draws more current. Although the effect described above could easily be demonstrated with a DC motor, an ammeter, and a battery connected in series, a methodical, quantitative study of the power consumed by a motor as a function of time is in order. Our objective in the present work was to investigate in detail energy consumed by a DC motor. Using two different current sensors, Adafruit’s INA219 and Sparkfun’s ACS712, we have measured the current through and voltage across a DC motor, run without a mechanical load, with a load for a brief period of time, and completely stalled for a brief period of time. With both sensors, we have measured the load voltage using the Arduino Uno microcontroller. We have documented the relevant circuit diagrams, the Arduino code in its entirety, and the correct experimental procedures.
Figure: Experimental set up for current measurement
Lesson Plan
Title: Lenz’s Law and Back EMF in DC Motors
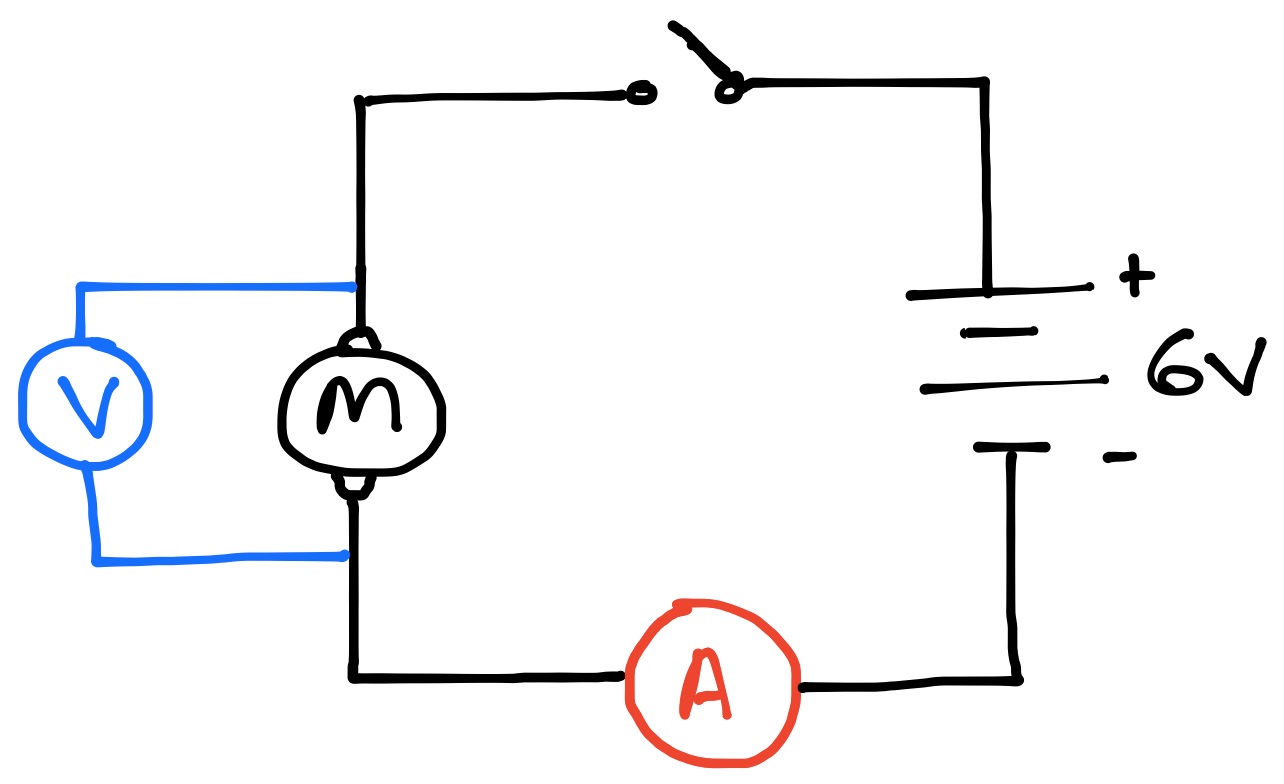
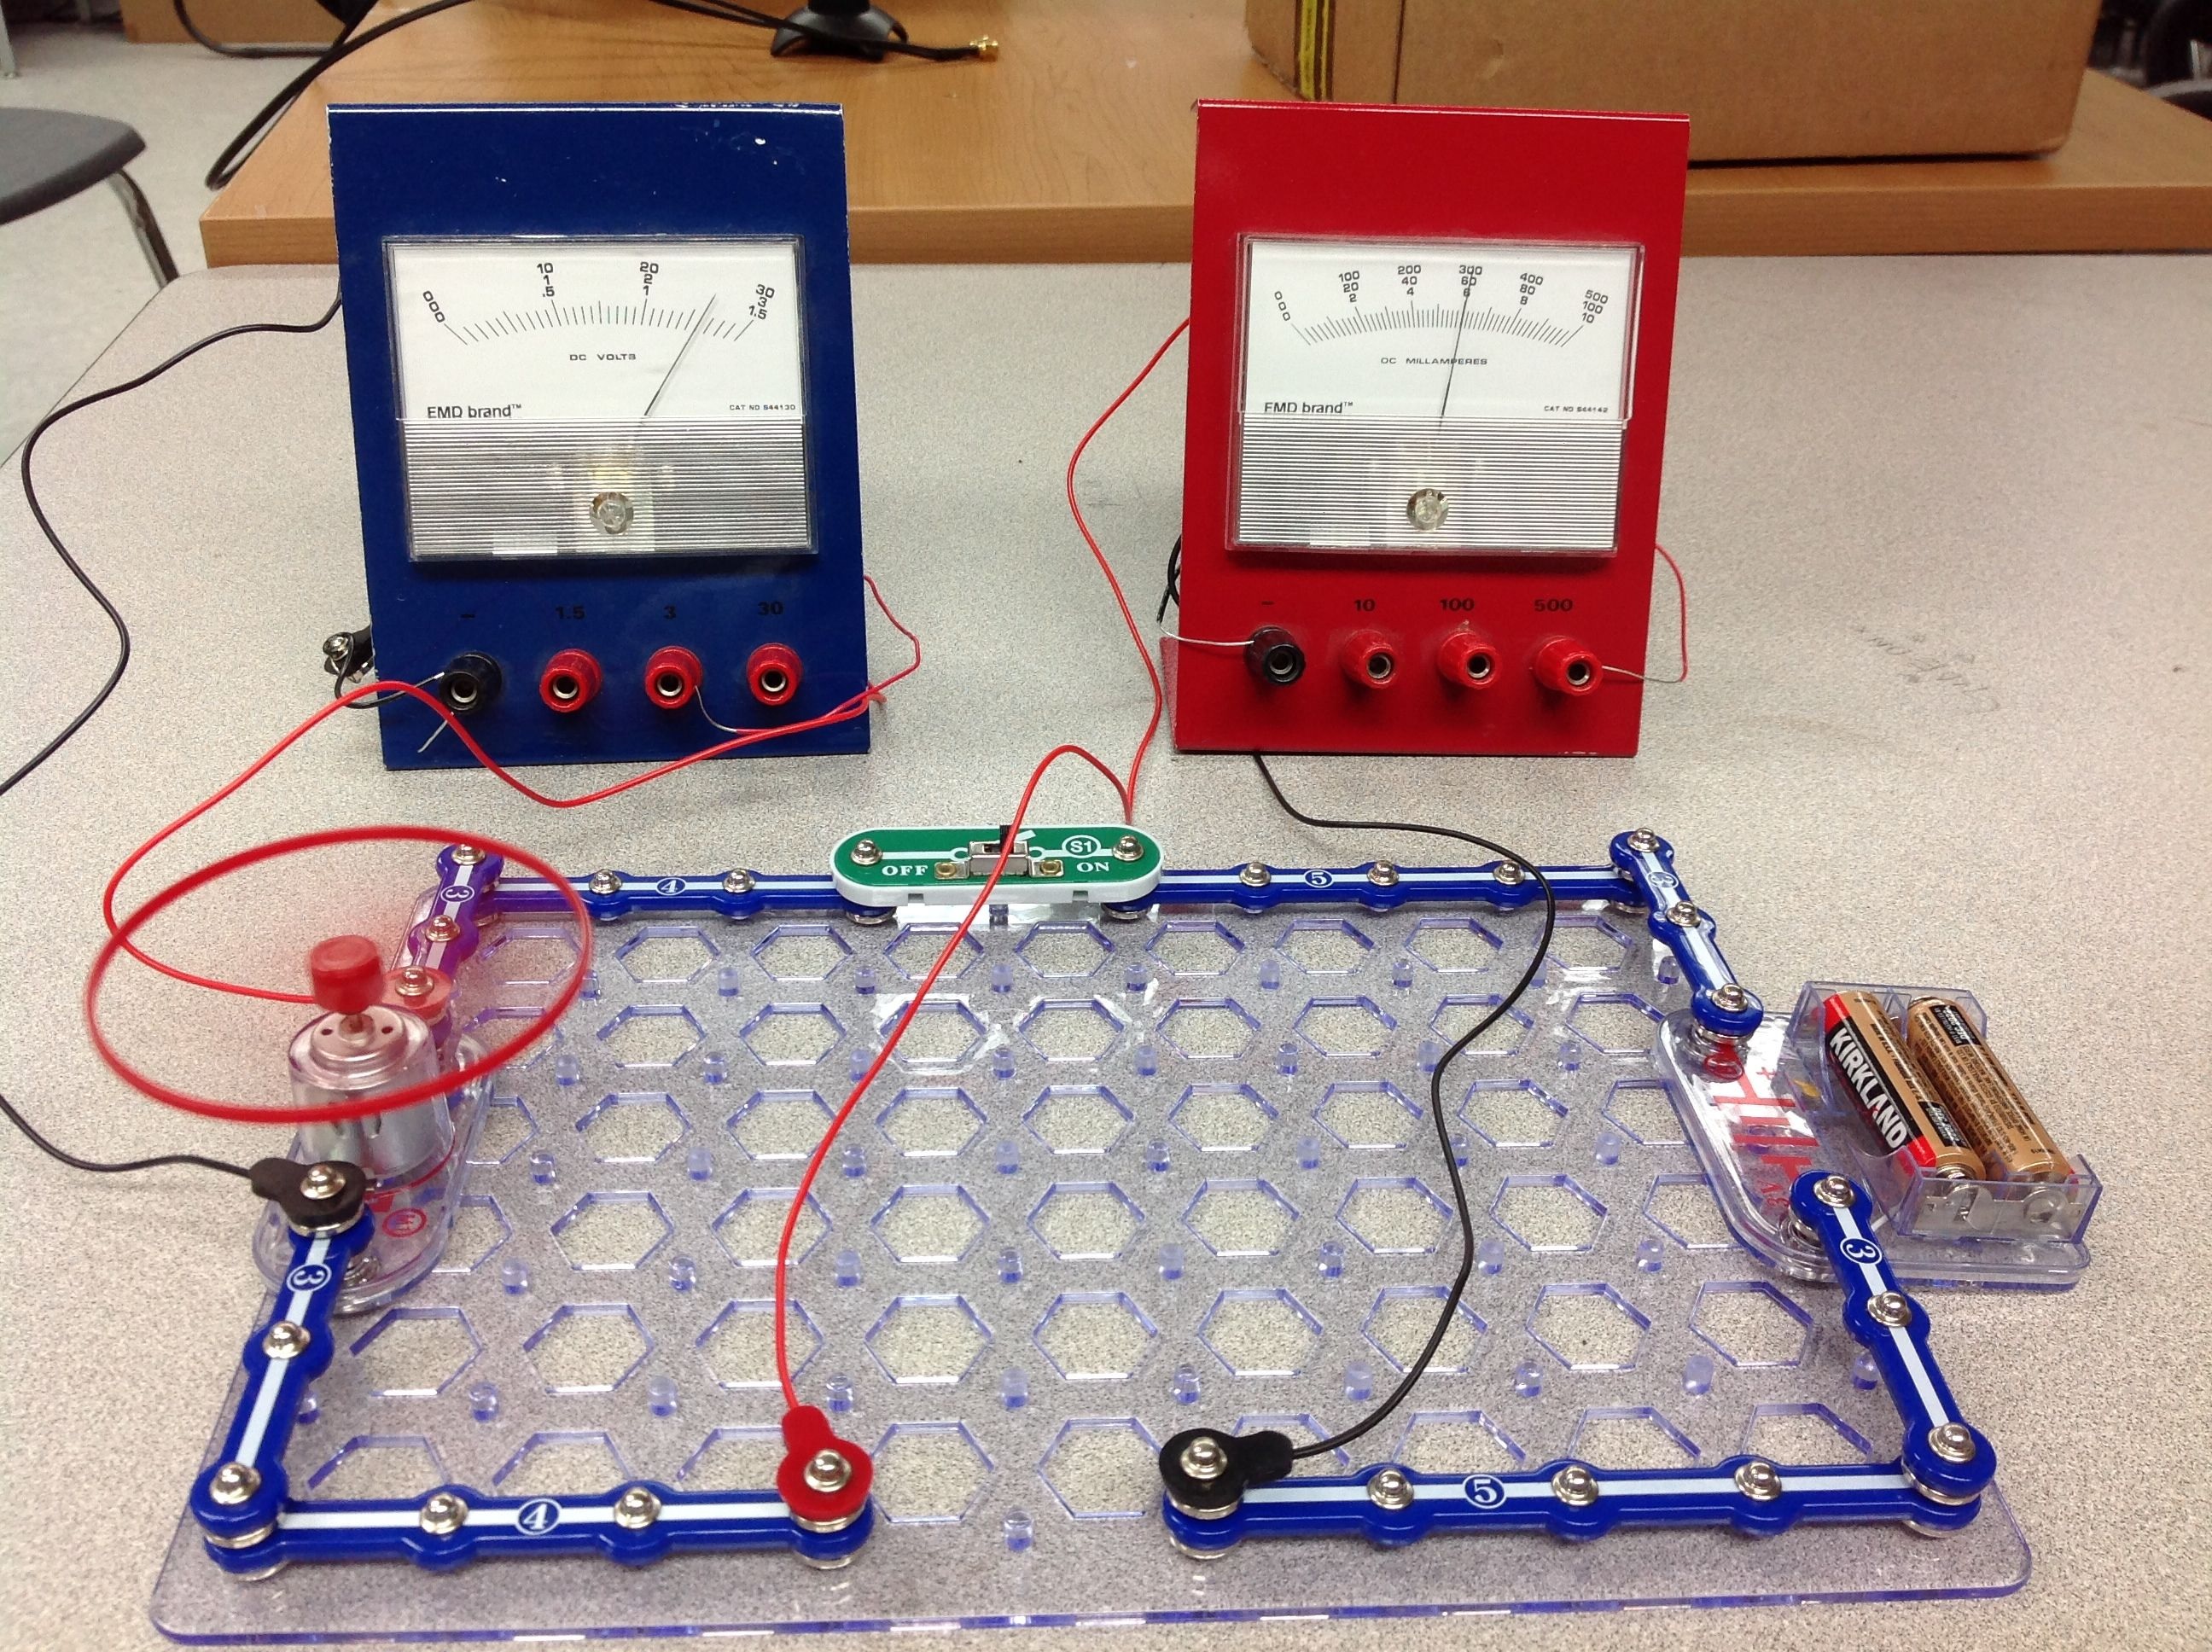
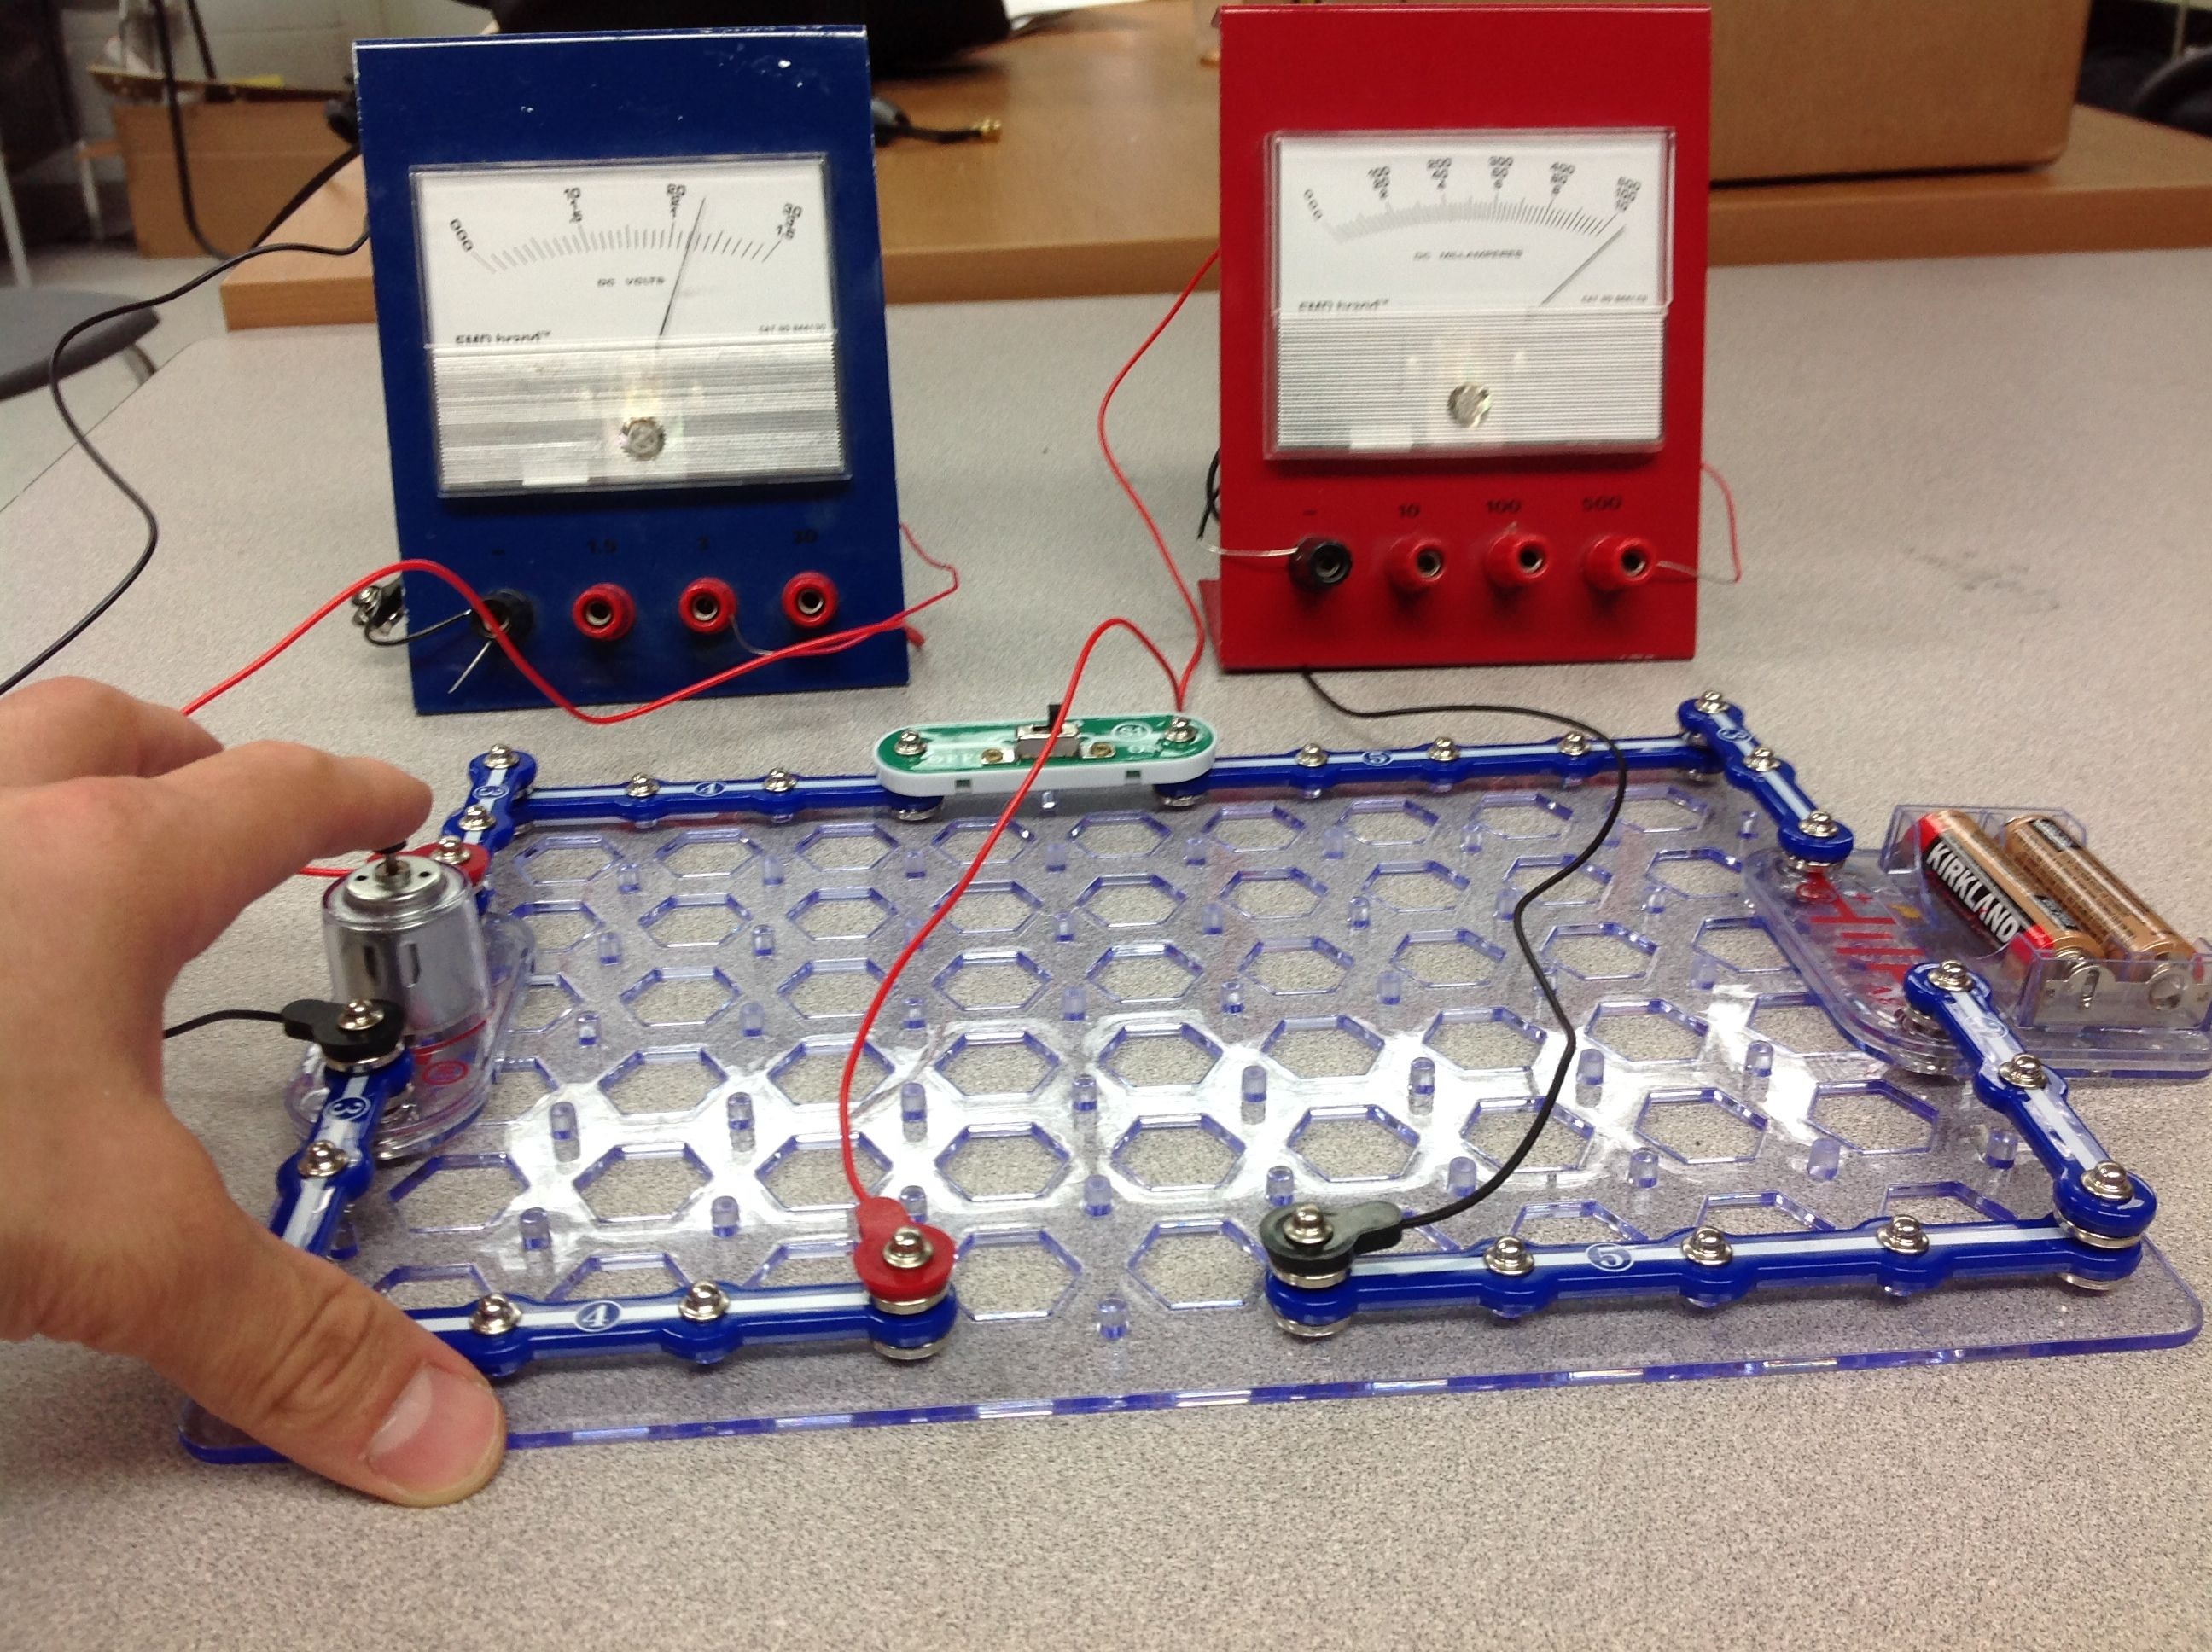
Students will set up a basic DC motor circuit with an ammeter and voltmeter to measure the current through and voltage across a DC motor as shown in Figure A. Students will take voltage and current data as the motor spins freely with no mechanical load on it and then they can apply a mechanical load either by placing an object like a propeller on the motor (Figure B) or by slowing it down with their finger (Figure C). What happens to the voltage and current in each mechanical load situation? These observations motivate a discussion of Lenz’s law and back EMF in DC motors.
Figure A: Circuit diagram for measuring current through and voltage across a DC motor
Figure B: DC motor with propeller as mechanical load
Figure C: DC motor with finger as mechanical load
Project 2: The Effect of Hemp Concentration in Natural Fiber Composites
Teachers: Charisse A. Nelson and Sarah Wigodsky Mentor: Dr. Nikhil Gupta, Research Collaborator: Chong Chen Xiang
Research
Title: The Effect of Hemp Concentration in Natural Fiber Composites
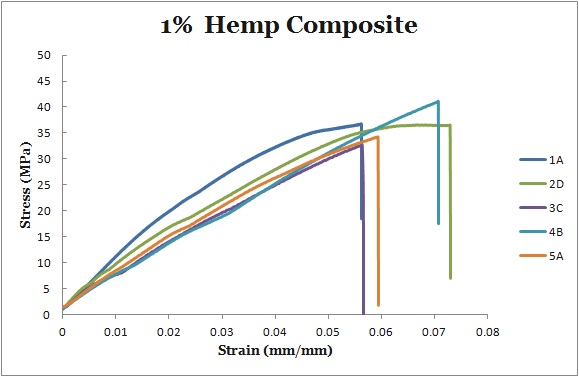
This research addressed the use of natural fibers in the creation of composite materials. Composite materials are formed when two or more materials are combined to create a new material. The goal is to create a new material that maximizes the strengths of the individual materials while minimizing their weaknesses. Using natural fibers allows for the creation of a new material that contains easily accessible, natural materials and is cost efficient to create. Our research focused on combining hemp fibers with epoxy and a hardener in 1-, 5-, and 10-percent concentrations. Once combined, tension testing was done to determine and compare their average modulus of elasticity and ultimate stress. This allowed us to determine which concentration of hemp composite was the most rigid and which could sustain the most force before breaking. It was determined via graphs of stress vs. strain that the modulus of the 1% samples was on average 616.8 MPa and had an ultimate stress of 36.33 MPa, which was the largest value for the concentrations we tested. The 5% samples showed a lower modulus of 573.33 MPa and an ultimate stress of 20.18 MPa. The 10% samples had the largest modulus of elasticity of 928.47 MPa and an ultimate stress of 21.35 MPa, which was much less than the 1% sample, but only slighter higher than the 5% sample. The stiffer a substance, the larger its modulus of elasticity. The 10% hemp concentration samples were the most rigid because of the strength of the hemp fiber. We expected the 10% hemp concentration samples to also have sustained the most force before breaking, and thus the highest ultimate stress; however, the 1% showed a higher ultimate stress. This could be based on the fact that as the hemp percentages increased so did the amount of air bubbles, which caused inconsistency in the uniformity of the samples and therefore increased the weakness of the 5% and 10% samples.
Figure: Tensile strength of 1% hemp composite samples
Lesson Plan
Title: Rebuilding New Orleans Composite Materials Lab
Students will play the role of composite material engineers when they work to create the best composite material to be used in an area that suffers from severe subsidence, such as New Orleans. Students create and analyze composite materials with the intent of optimizing strength while minimizing density. The composite materials are made of puffed rice cereal, marshmallows, and chocolate chips. Students will vary the concentrations of the 3 components to create 3 unique composites. Then they will determine the density of their materials and their compressive strengths by placing weights on top of them and measuring the amount the materials compress. Finally, students will graph stress vs. strain in order to determine the Young's modulus of each sample so they can analyze the strength of their materials.
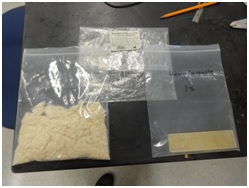
Figure: Composite samples made using puffed rice cereal, marshmallows, and chocolate chips
Project 3: The Feasibility of Growing Medicago sativa in a Transparent Hydrophilic Medium
Teachers: Angeleke Lymberatos and Louis Morgan, Mentor: Dr. Magued Iskander, Research Collaborator: Sophia Mercurio
Research
Title: The Feasibility of Growing Medicago sativa in a Transparent Hydrophilic Medium
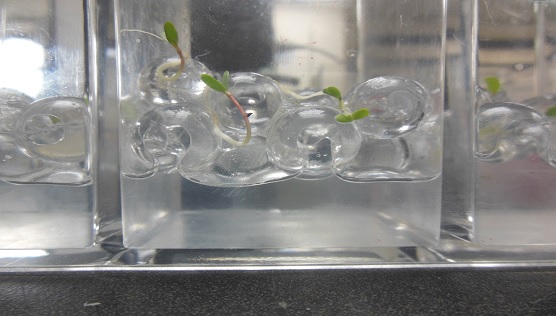
The versatile alfalfa (M. sativa) was used in this study to examine the sustainability of plant life in a hydrophilic transparent medium. To create the transparent medium we used aquabeads, a hydrophilic copolymer of isobutylene and maleic anhydride. Aquabeads, capable of absorbing ×200 water, has a similar refractive index as water so it can become transparent. Thus aquabeads is ideal for creating a transparent medium that makes it possible to observe the growth of plant roots. M. sativa was used in this study because of its versatility, low water consumption, and its high nutritive and ecological benefits. There has been relatively little research on the sustainability of transparent media for plant growth. Alfalfa sprouts were grown in containers of the transparent medium, while monitoring light intensity, pH, and temperature. Alfalfa grows best under low light intensity. A successful alfalfa growth in a transparent medium would have tremendous application in green design. Green roofs on commercial buildings may help to create high ratings on LEED (leadership in energy and environmental design) certifications, which may lead to a higher property value. Alfalfa has high aesthetic value due to his fast growth and high biodiversity- and may contribute tremendously to the LEED ratings of commercial properties.
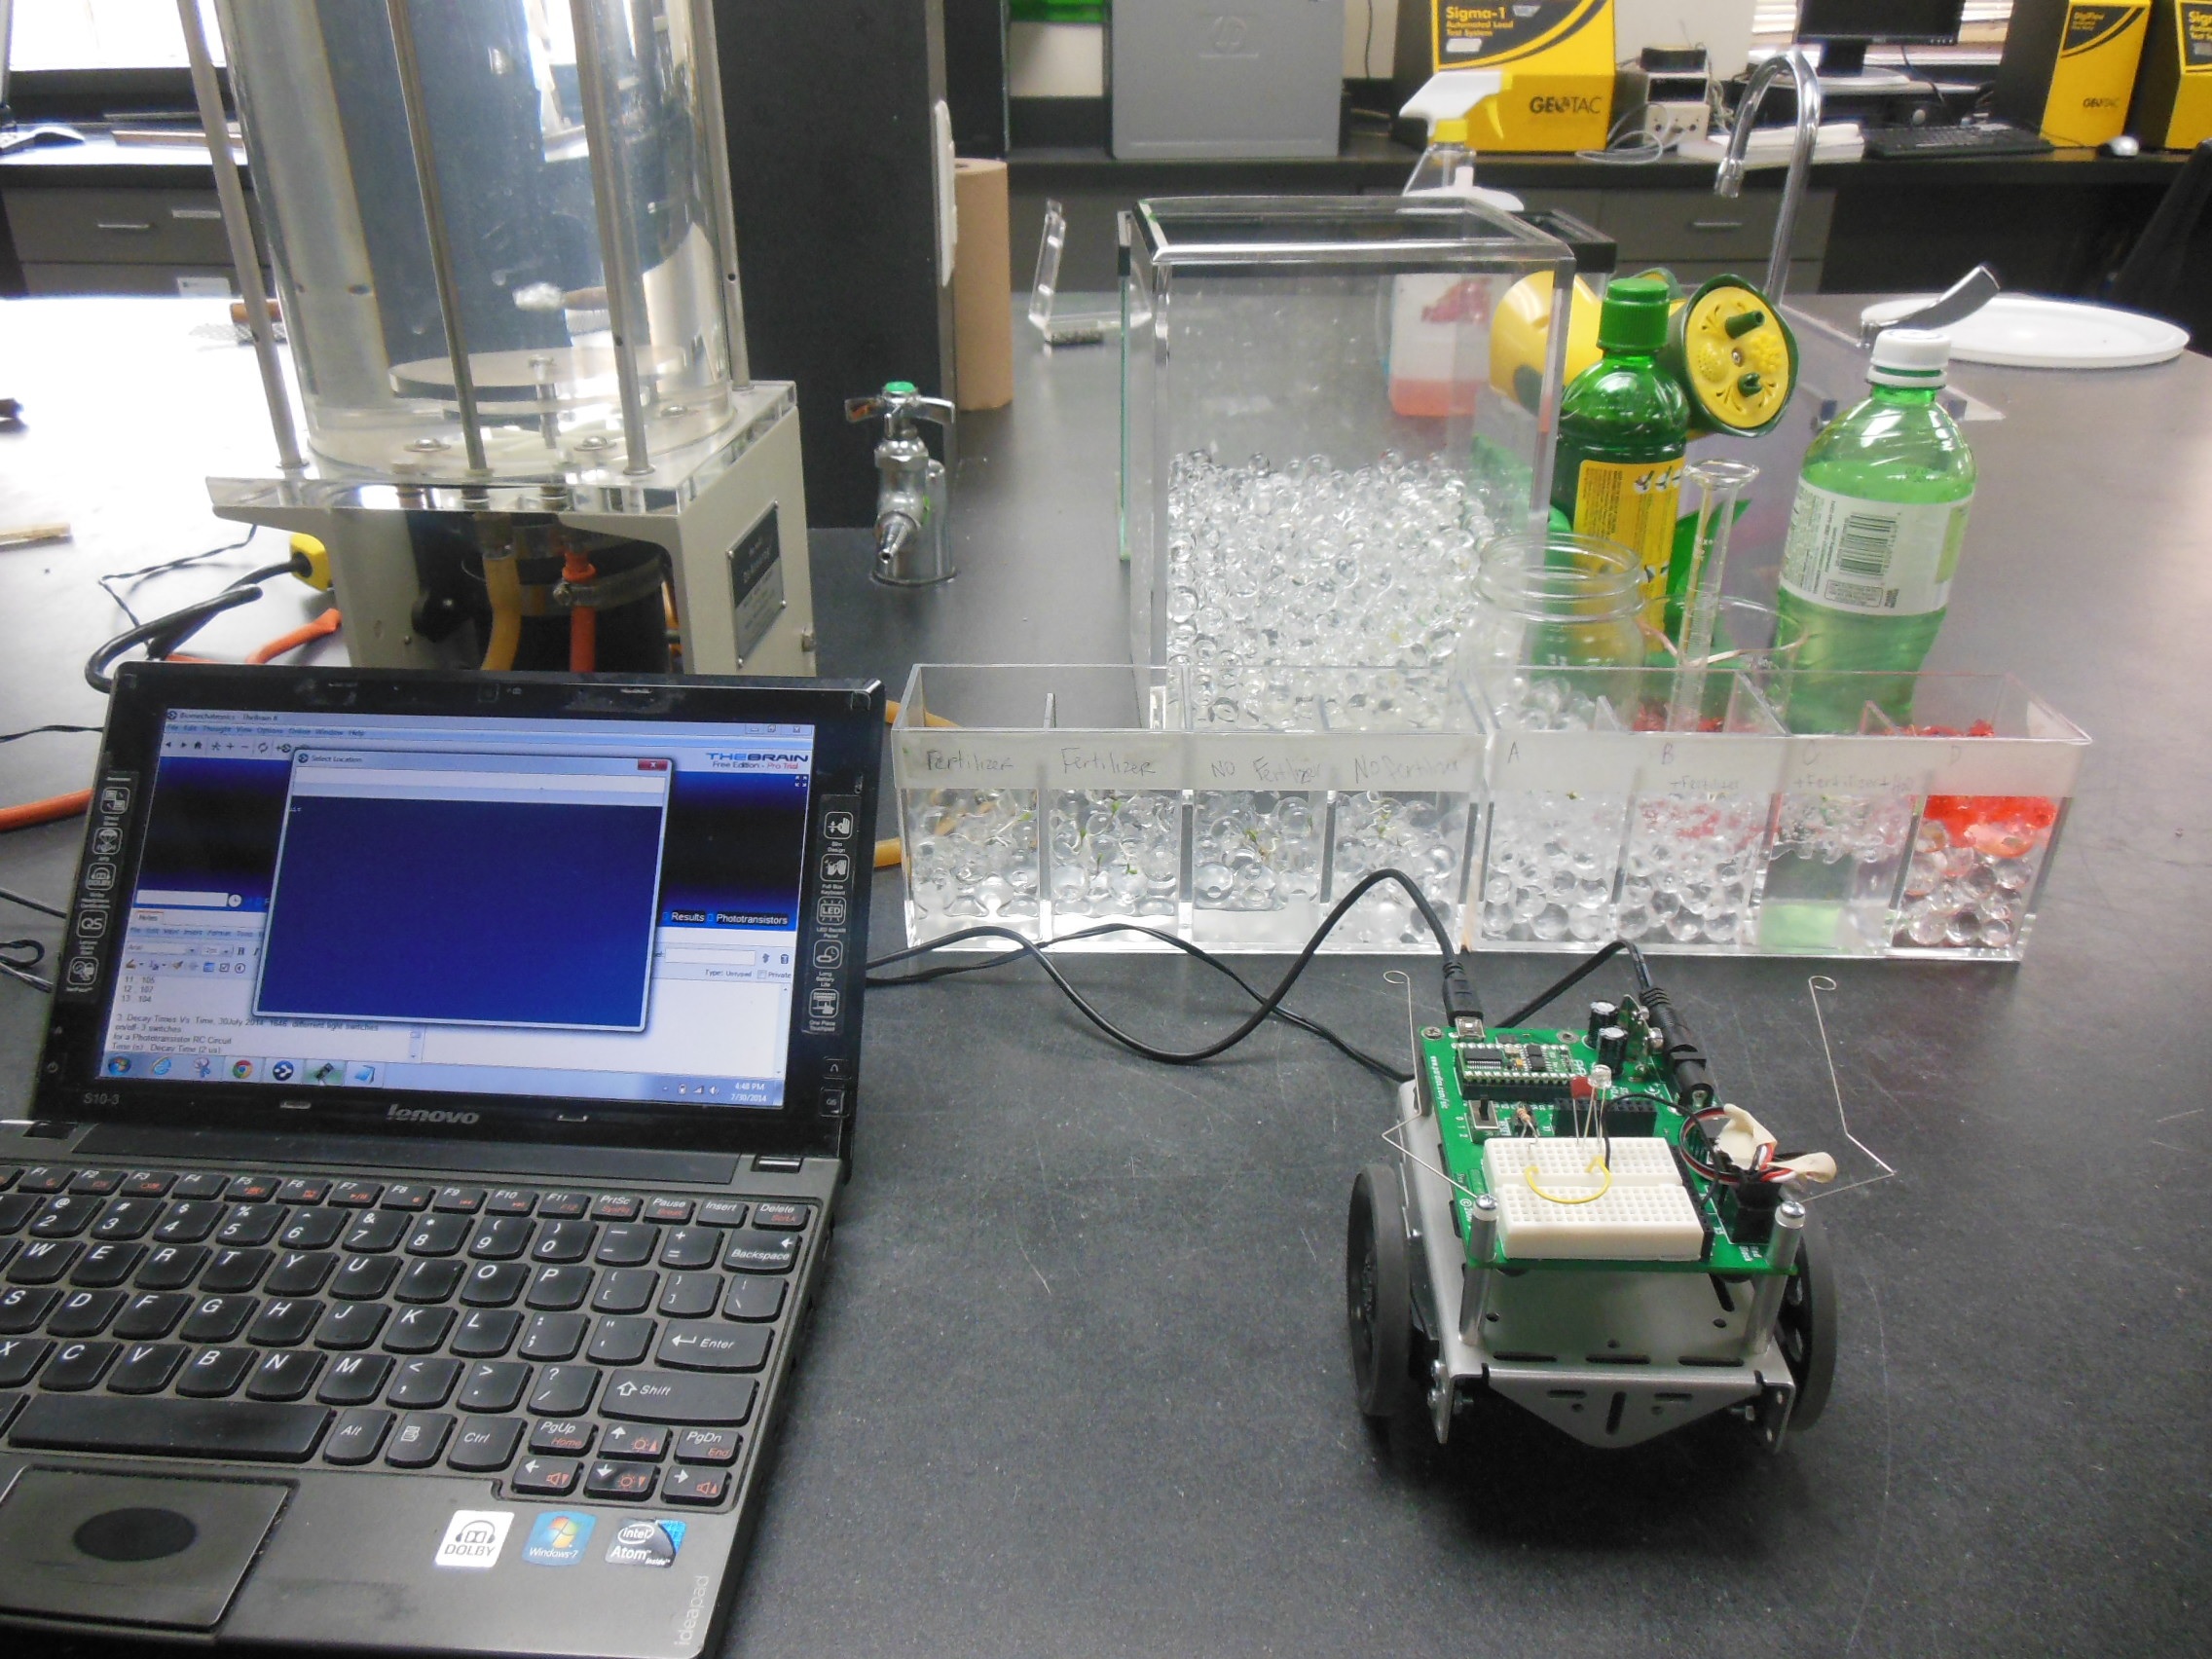
Figure: Testing light intensity during alfalfa growth in transparent medium
Lesson Plan
Title: Seed Growth in Transparent Soil
A group of students will conduct a controlled experiment in the classroom for a period of three weeks. Students will take measurements and analyze seed growth and determine the most favorable conditions for alfalfa seed growth in the transparent soil. Students will track seed growth and pH. Students will also use the BoeBot equipped with a phototransistor to measure the light intensity over the three-week period. Like engineers, students will construct building models with vertical farming models built into them to demonstrate how alfalfa seeds will be successfully grown. Students will present their findings to the class.
Figure: Planned classroom activity
Project 4: Tracking and Distance Detection Methods for a Humanoid Robot
Teachers: Lisa Ali and Michael Zitolo Mentor: Dr. Vikram Kapila, Research Collaborator: Jared Alan Frank
Research
Title: Tracking and Distance Detection Methods for a Humanoid Robot
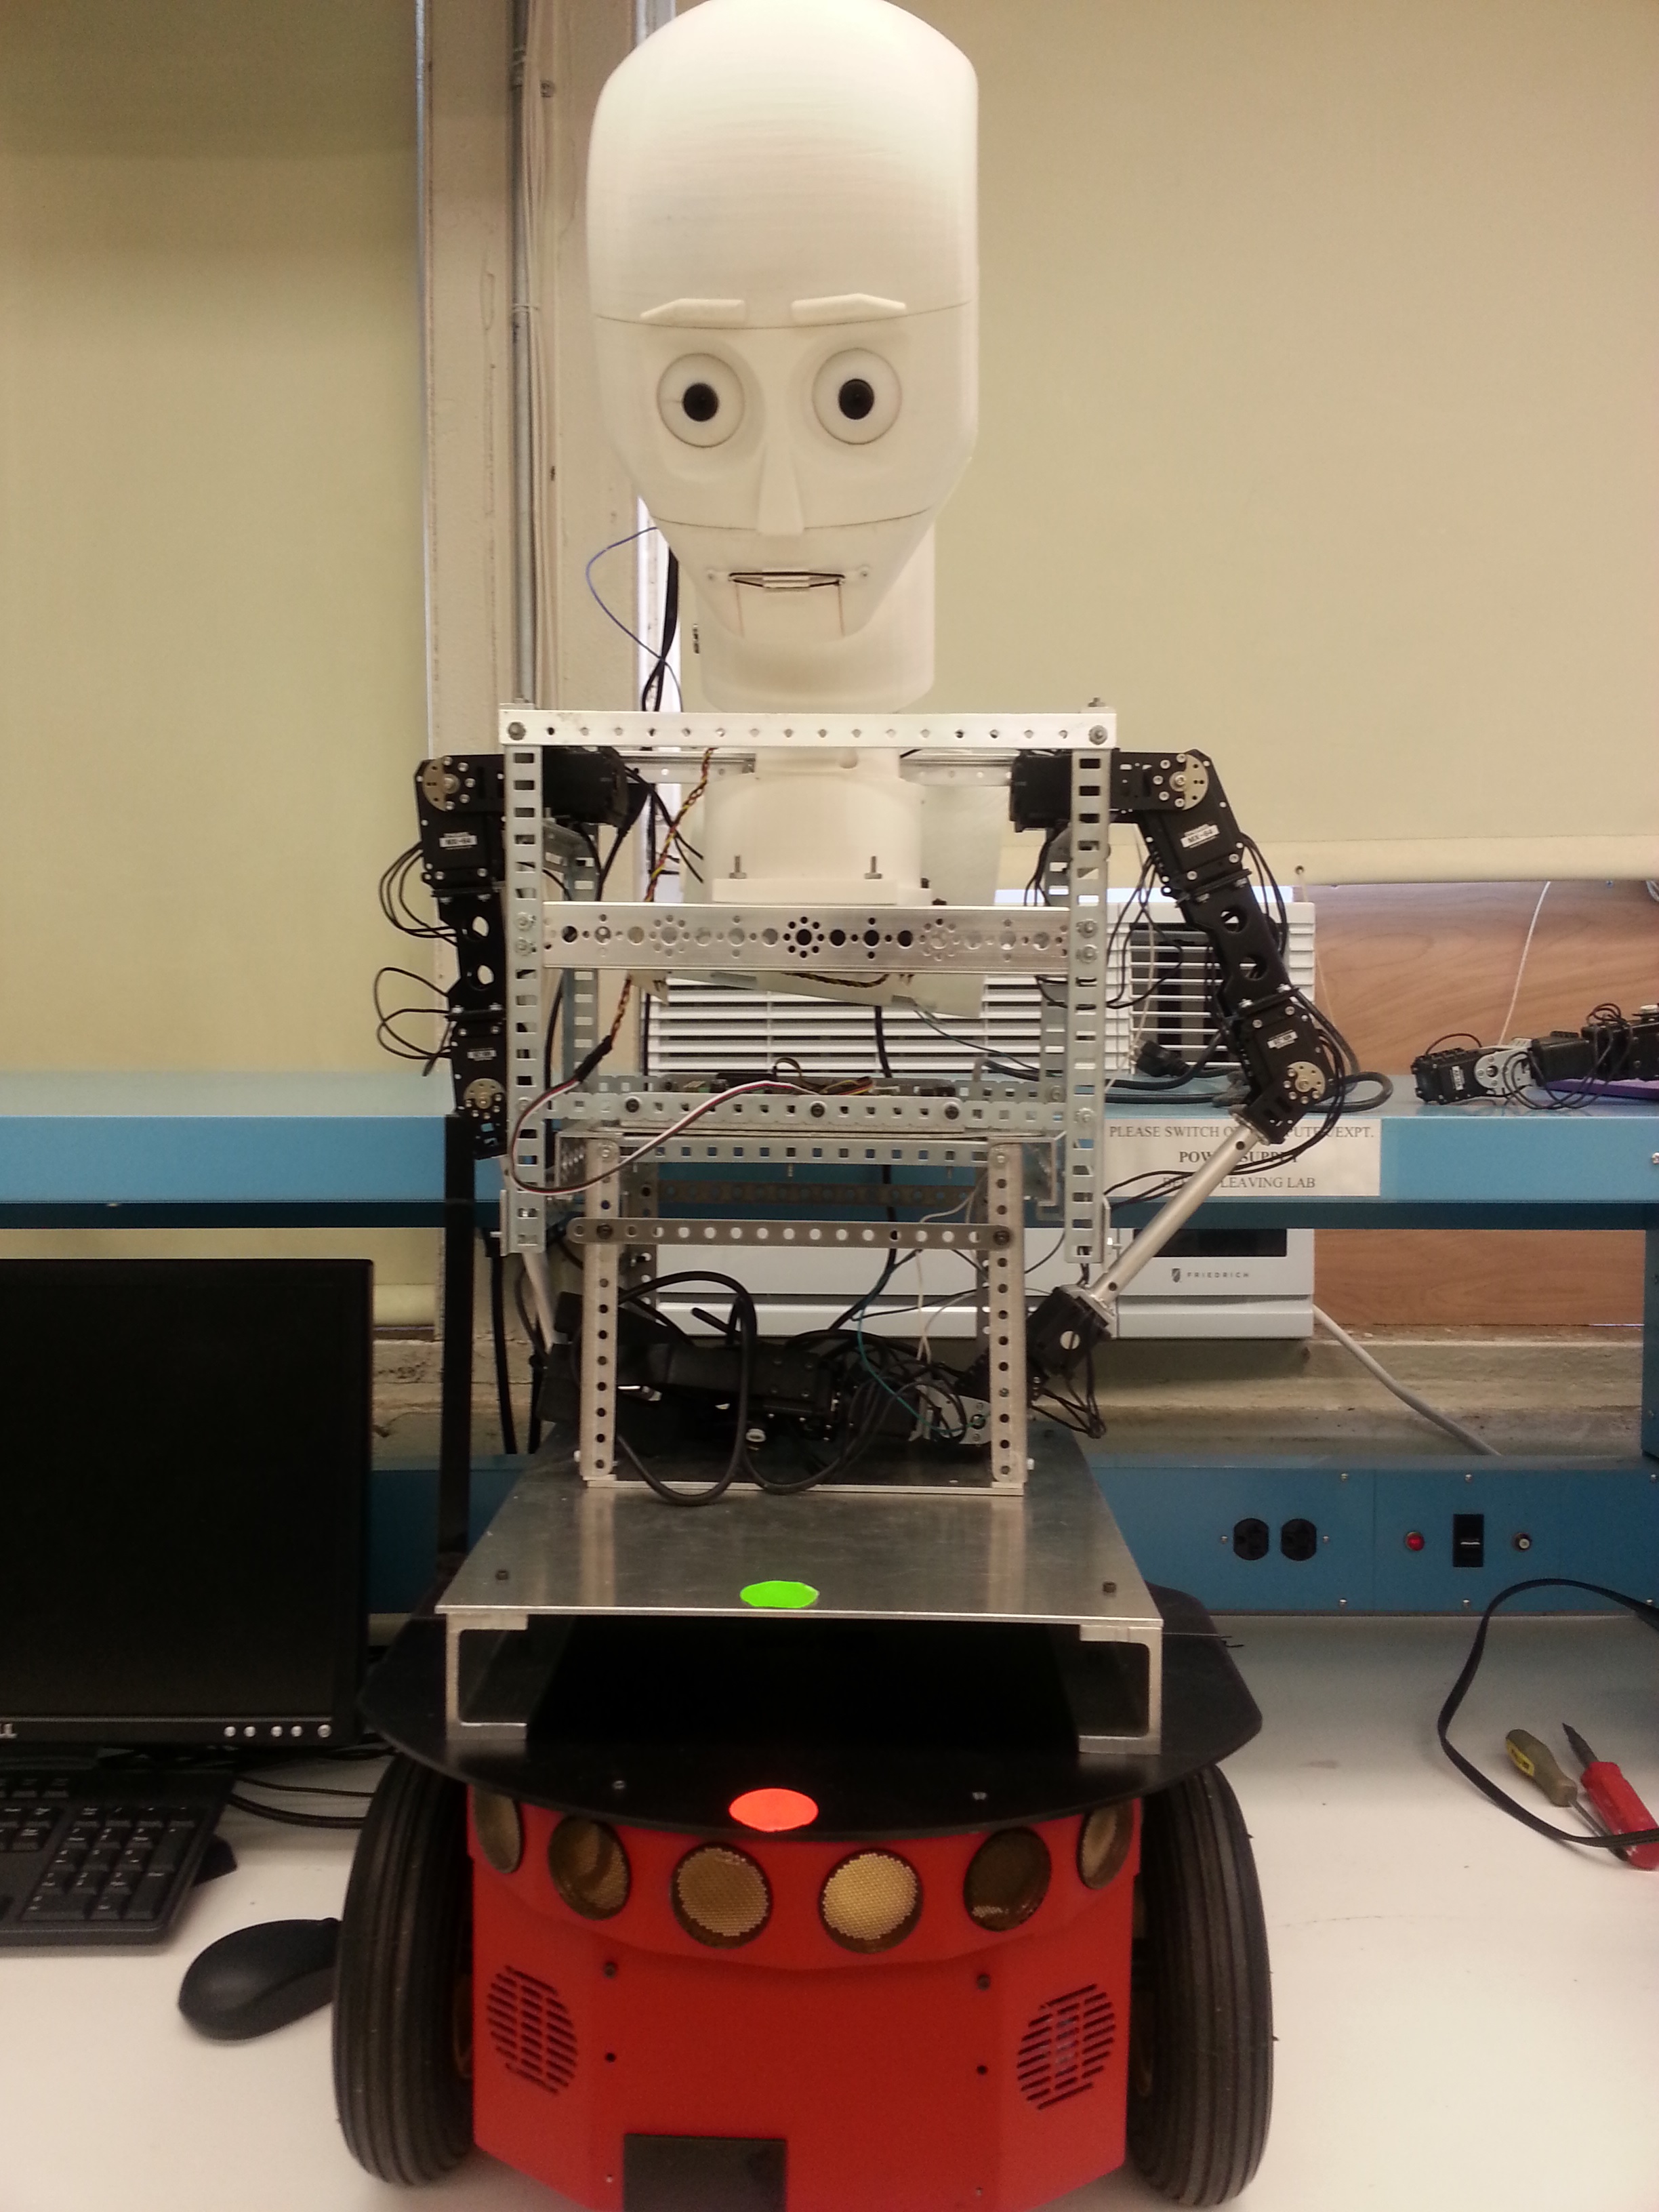
Humanoid robots are robots with resemblance to qualities/features of the human body. These robots have two arms, two legs, a torso, etc. Some humanoid robots even have facial features resembling that of a human. Cellularly Accessible Expressive Semi-Autonomous Robot (CAESAR) is a humanoid robot in development at NYU-Polytechnic School of Engineering’s Mechatronics and Controls lab. Currently, CAESAR’s eyes consist of two cameras that are being used for tracking and distance detection of various objects. Open Source Computer Vision (OpenCV) is being used to design a program that allows CAESAR to find and track an object of a certain color and shape in its field of view, based on the user’s request. The computer processes images that it collects from the camera; it then communicates that information to an Arduino. The Arduino Mega 2560 then communicates with the Arbotix-M to drive the motors to its desired location.
Lesson Plan
Title:Introduction to Physical Computing using Arduinos
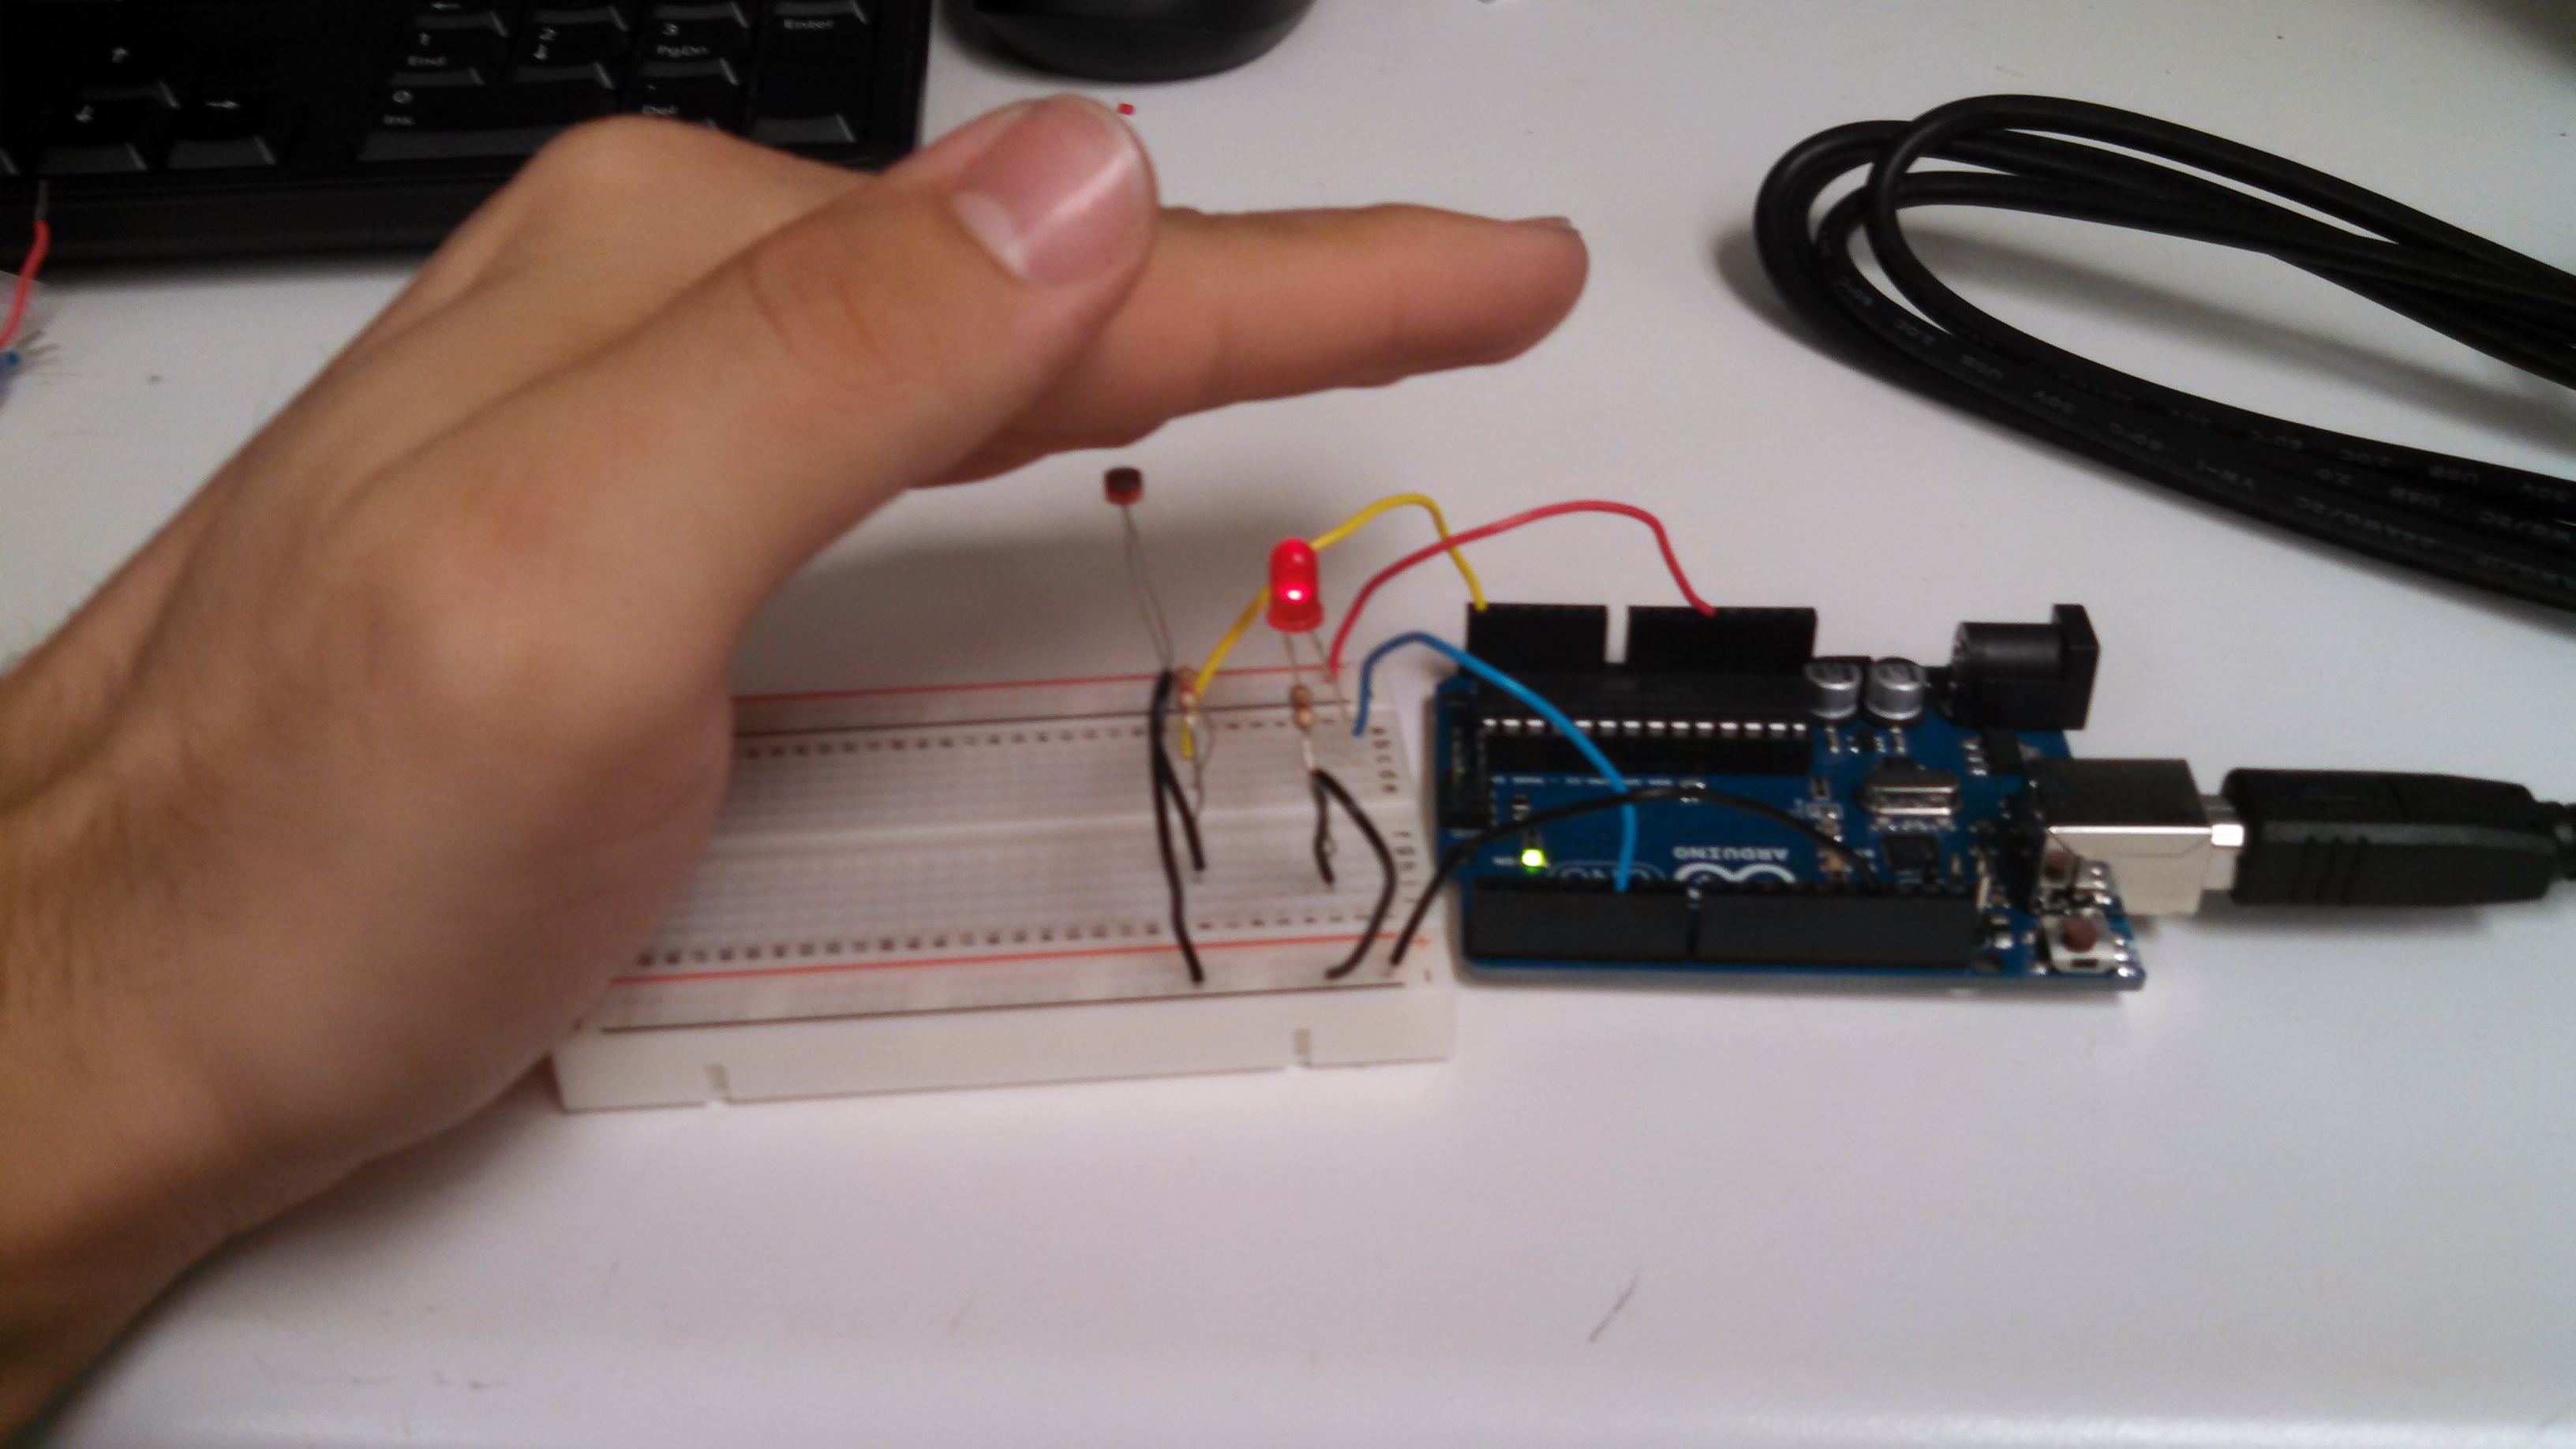
Arduinos are an easy hook to engage students in STEM. Through the course of this lesson, students will apply a basic understanding of computer science and circuitry to develop simple “robotic” systems of actuators and sensors controlled by the Arduino board, a process known as physical computing. The students will first build simple setups and type up programs provided to them with clear instructions. Once they observe how the system functions, they then extend this basic understanding by modifying the original program and setup to accomplish new tasks. This 3-day lesson culminates in a design project where students build and present a novel simple robotic system using a variety of components, such as LEDs and photo-resistors.
Figure: When the photo-resistor is covered, the Arduino lights the LED
Project 5: Teaching Emotion Recognition to Autistic Children with CAESAR
Teachers: Ulugbek Akhmedo and Lee Hollman, Mentor: Dr. Vikram Kapila, Research Collaborator: Jared Alan Frank
Research
Title:Teaching Emotion Recognition to Autistic Children with CAESAR
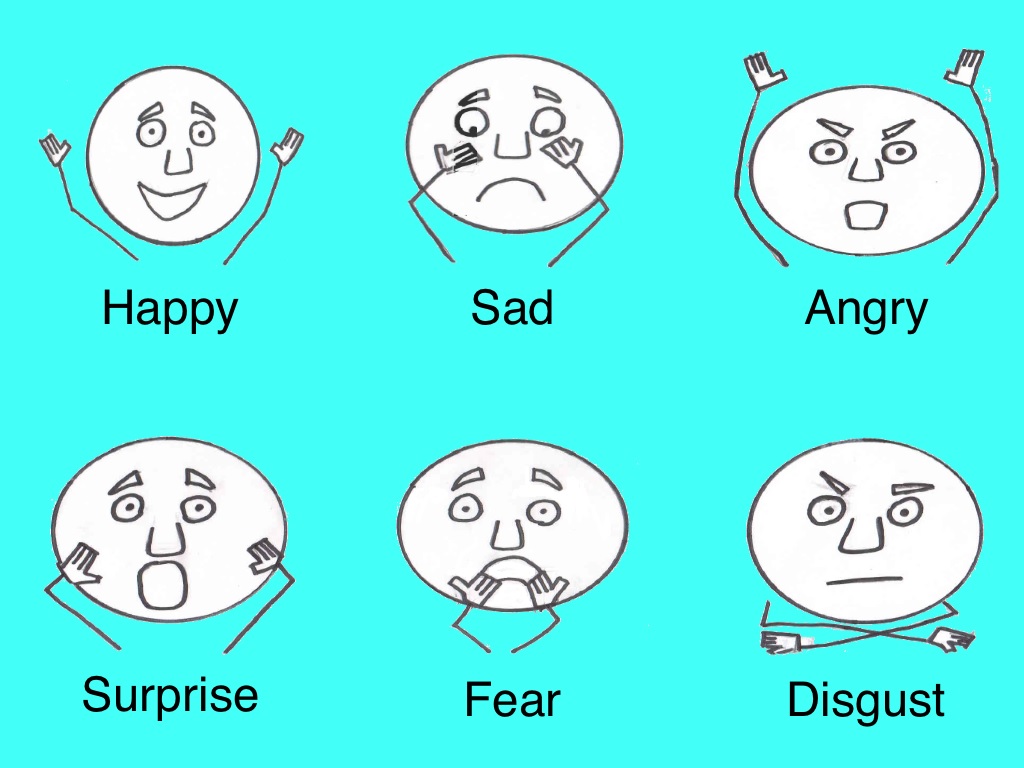
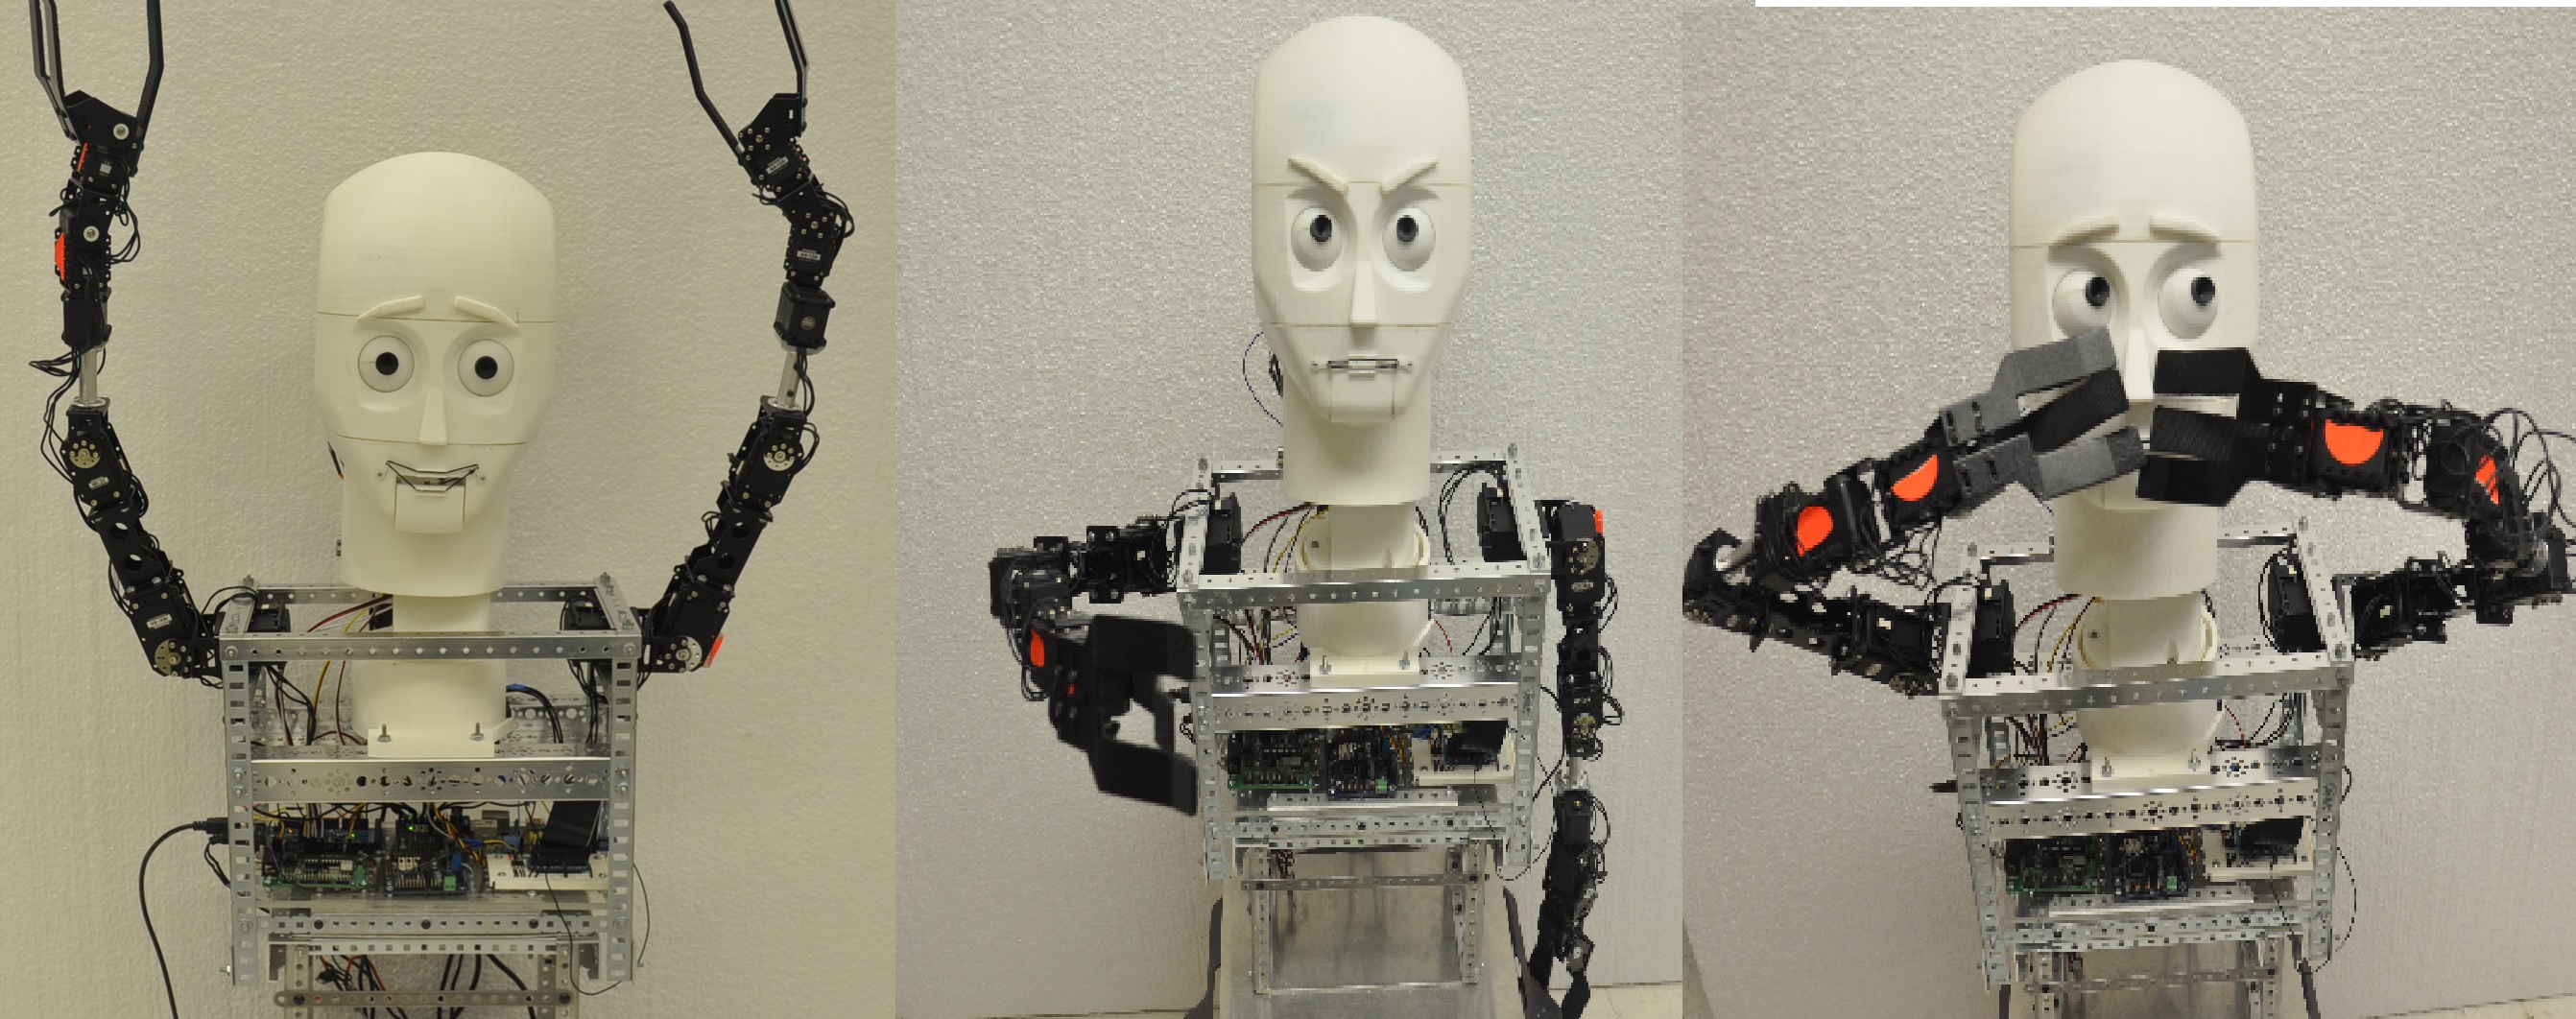
Autism Spectrum Disorder (ASD) is a developmental disorder typified by repetitive actions, impaired communication and social skills, and delayed language development. Often autistic children fixate on one particular object in their environment and exhibit a heightened fondness for mechanical toys that move in predictable, repeated patterns. Children with ASD experience difficulty with self-expression and are overwhelmed by the subtleties of human facial expressions vis-à-vis the relatively simpler interaction with mechanical objects. Currently robotics is being explored to help engage autistic children to learn language skills and to develop empathy through caring for a robotic “pet.” However, robot therapy options to engage autistic children to learn emotion recognition and emotion expression skills remain to be fully explored. Our work focused on Cellularly Accessible Expressive Semi-Autonomous Robot (CAESAR), a humanoid robot in development at the Mechatronics Lab of NYU Polytechnic School of Engineering. In particular, we worked on enabling the robot to make recognizable facial expressions that can be recognized by autistic children so that the skill developed with the robot can transfer to social interactions with other humans. An iPad app was designed to enable the children to select one of six specific emotions. Touching one of the expression icons enables CAESAR to enact the corresponding emotion dynamically, i.e., using facial expressions and arm gestures that reinforce the emotional state being portrayed. The emotions were based on psychologist Paul Ekman’s research into non-verbal communication and his “Six Universal Emotions”, the most immediately recognizable facial expressions that he observed among international cultures. The expressions of happiness, sadness, anger, surprise, fear and disgust are Ekman’s universal emotions that are incorporated in our app. CAESAR and the emotion recognition app enables autistic children to strengthen emotion recognition skills by repeated exposure to the same facial expressions. The designed platform can also be used to help autistic children identify and express their own emotional state given their language deficits. CAESAR and the app are unique among the few emotion recognition options available among autism robot therapies in that the children can select the emotions that the robot demonstrates, allowing them to communicate through CAESAR in addition to building their social skills.
Figure: Emotion prototypes
Figure: CAESAR is happy(left), angry (middle), and afraid (right)
Lesson Plan
Title: Infrared Temperature Measurements with the Boe-Bot: Real-world Robotics
Chernobyl and Fukushima have made recent news as the sites of some of the worse nuclear disasters in recent history, but how much do we really know about how those disasters were managed? This lesson requires students to view themselves as engineers at one of these sites who are tasked with determining how rapidly radiation disseminates to create an evacuation plan. The students use a mathematical table or inverse square law to predict the rate at which radiation leaks spread. To simulate how to detect the spread of radiation, students build a circuit using the Parallax Boe-Bot with an infrared sensor and review code for detecting light and heat sources. The Boe-Bot uses the infrared sensor to detect heat from a nearby light bulb that simulates the radiation, moving at intervals directly related to how much light and heat the sensor detects. Students will have the opportunity to revise the code and will use the inverse square law to determine if there are patterns to the extent that the light and heat increases from the source.
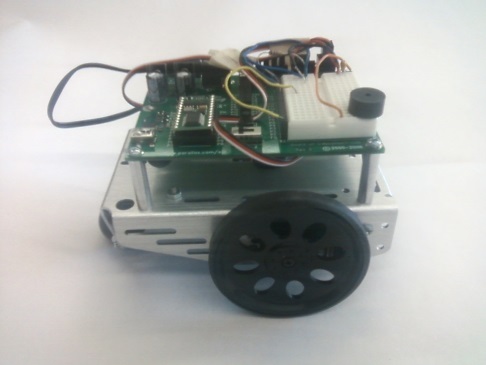
Figure: The Parallax Boe-Bot used for the lesson. The piezoelectric speaker attached to the circuit board sound an alarm at regular intervals when detecting heat and light.
Figure: An actual map of the Fukushima nuclear disaster charting the spread of radiation and evacuation plant. The map is used to introduce the lessons and to emphasize its real-world applications.
Project 6: The Enhanced Development and Testing of the Abaxial Appendage of a Bio-mimetic Platform for Fish Mating Behavior
Teachers: David Arnstein and Horace Walcott, Mentor: Dr. Maurizio Porfiri, Research Collaborator: Bethany Weber
Research
Title: The Enhanced Development and Testing of the Abaxial Appendage of a Bio-mimetic Platform for Fish Mating Behavior
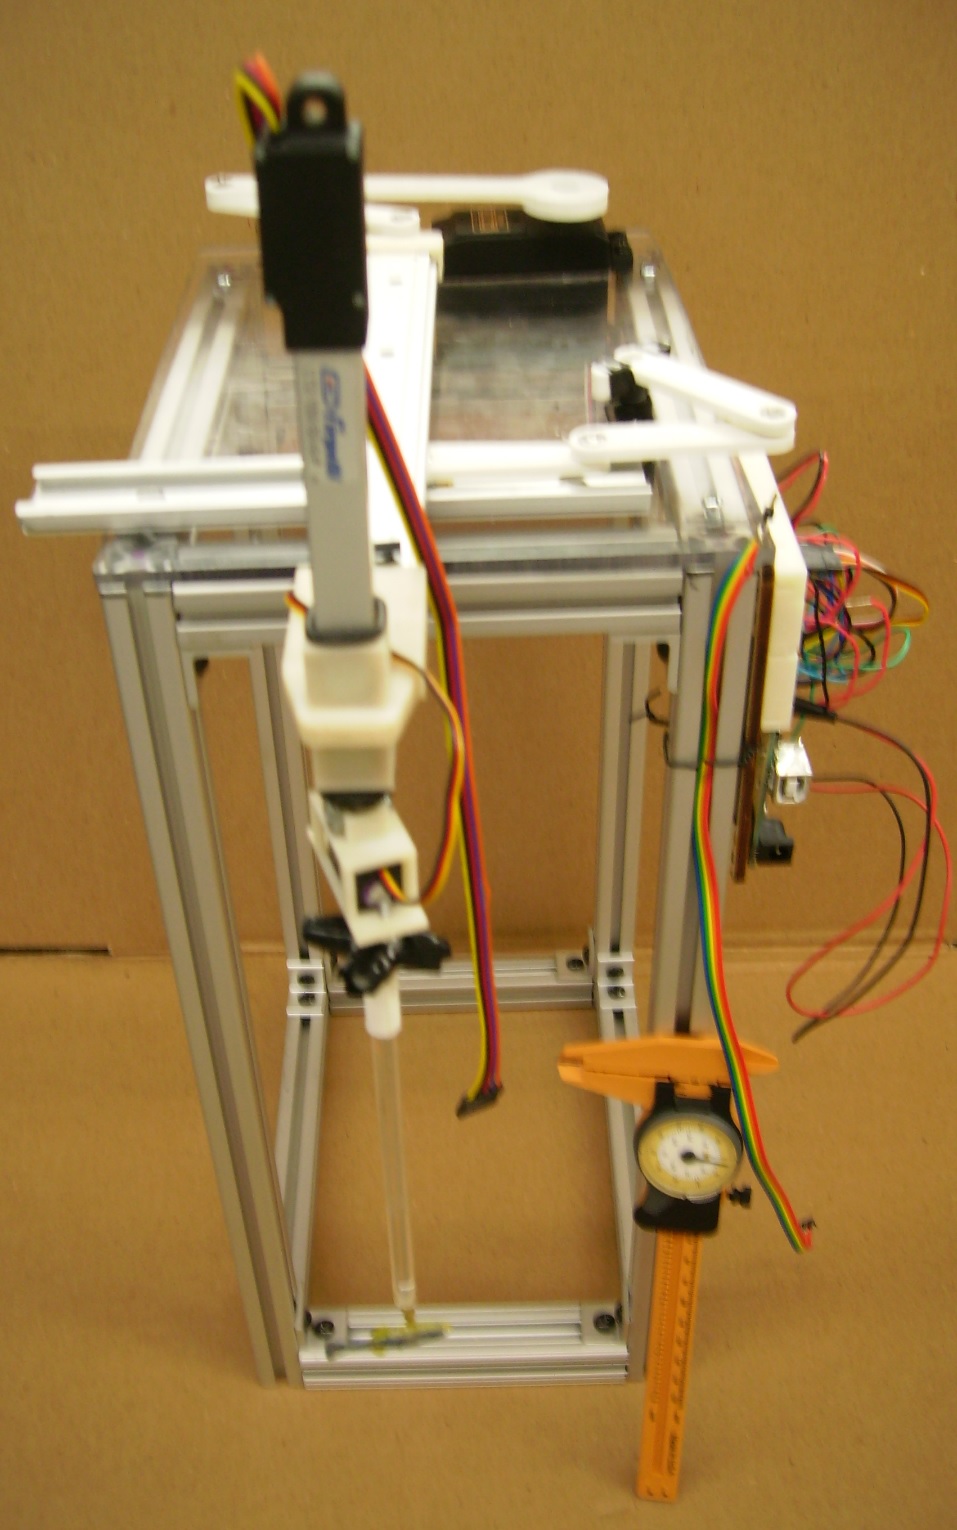
We formulated and tested three hypotheses. Hypothesis I: The displacement of a fish replica due to simultaneous linear motion along the x and y-axis, results in the fish replica moving in a spatial probability defined as an ellipse. Hypothesis II: The vertical, z displacement of the support rod due to the linear actuator, while the rod undergoes simultaneous linear motion along a horizontal x and y-axis, results in a spatial probability defined as a parabolic cylinder. Hypothesis III: A biomimetic replica can be used to stimulate live fish and the analysis of resulting fish behavior can show differences resulting from physiological or genetic variations. The experiments to test the first two hypotheses were conducted. The components were designed in Solid Works (SW). The whole platforms, including the new appendage, were assembled in SW. Computer simulations and mathematical analyses were performed in SW. Videos of the virtual functioning of the platform and the motors constituting the structure of the platform were analyzed using the Pro-Analyst software. Manual analyses of the geometry of the models for the fish trajectories were also performed. The plastic components of the arm were fabricated by means of the Dimensional Elite industrial 3D printer. A Makerbot printer was also used. The major part of the platform was constructed with 2 cm × 2 cm aluminum t-slotted frame. A program code to operate the platform was written using the Arduino software. The platform was assembled and the motion of the appendage with the fish replica recorded as videos. By means of the ProAnalyst software, the videos will be analyzed. We were able to demonstrate that the experimental data were consistent with our hypotheses.
Figure 1. The Bio-mimetic platform with its appendicular appendage
Lesson Plan
Title: Restless Baby Syndrome (RBS)
Students will investigate a hypothetical syndrome called “Restless Baby Syndrome” (RBS). This syndrome will be documented on a website which consists of case studies, videos of [actor] parents whose babies suffer from the syndrome, and data collected by a [fictitious] local hospital. Teams of students will have to analyze the information presented, develop a hypothesis about the cause of the syndrome, and “invent” a solution to help families deal with the problem. Students will present their solutions and be evaluated by their peers. This project will kick off a year of design/engineering projects intended to prepare students for the Innovention competition next Spring. As students read and watch the material presented on the RBS website, they will learn that RBS causes babies to sleep poorly, cry for hours, and generally raise the stress level in households. Desperate parents try all kinds of things to “cure” the syndrome and their efforts are documented in case studies. In addition, medical records of the babies presented in the case studies are given. Mathematical analysis of this data will show a strong correlation between a RBS patient’s heartbeat, and the rate at which a parent rocks the baby to settle them down. (Research will show that rocking is the only thing that can settle a RBS baby and let them sleep.) Optimum solutions will require the ability to rock a baby with precise period/frequency related to the baby’s heartbeat.
