AI & Local News Challenge, Information Tracer
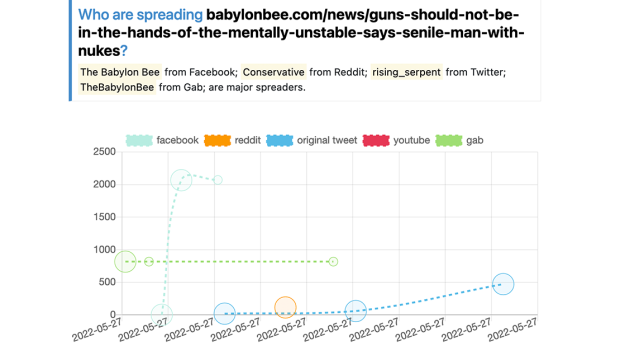
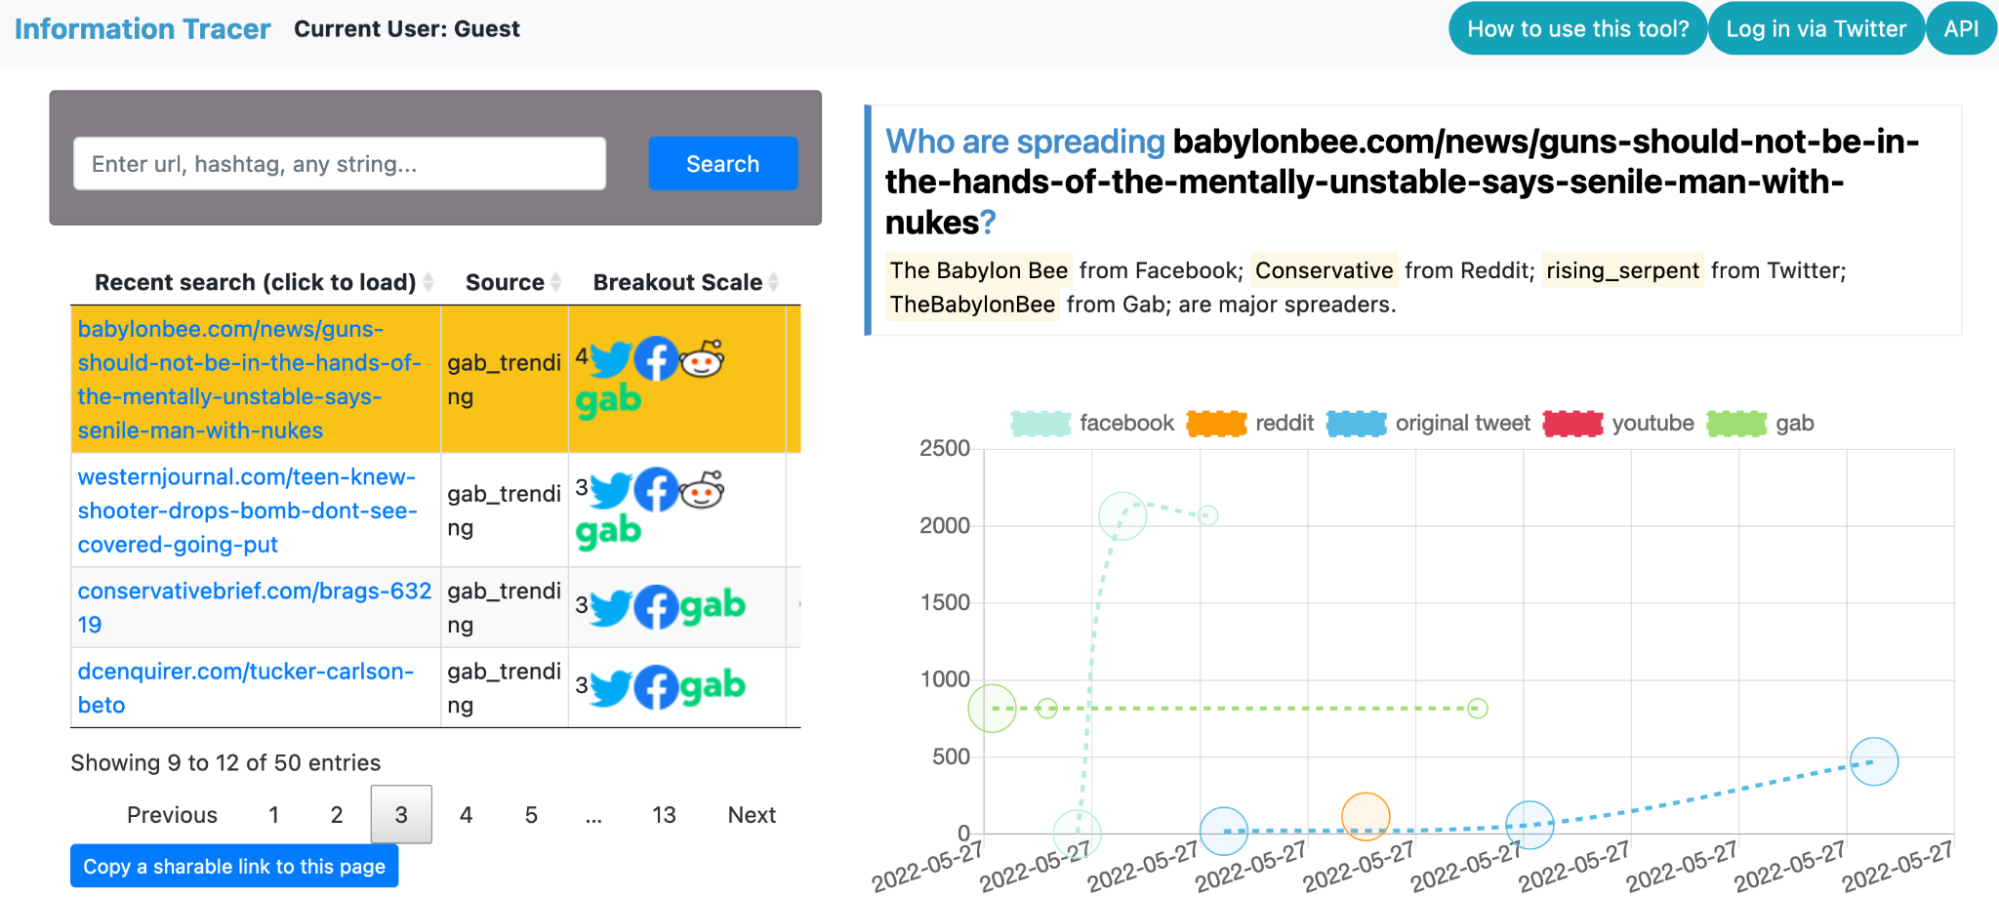
Information Tracer web interface. Users can visualize how posts containing the query–an article from Babylonbee–is shared on different platforms. The x-axis is the timeline, and the y-axis is the cumulative number of interactions on each platform. There are lines colored to represent interactions on facebook, reddit, gab and the original tweet.
RESEARCH & INNOVATION | CENTERS | NYC MEDIA LAB | PROJECTS | AI & LOCAL NEWS
The quality of online information is deteriorating. Hate speech, influence operations, bot accounts and fake news all contribute to the worsening environment. To address those challenges, researchers need real-time data and actionable intelligence to trace information spread and to identify suspicious spread patterns.
Information Tracer is our solution to this problem. Information Tracer is a service to provide fine-grained intelligence about how information spreads online to journalists, researchers and technology companies.
How does Information Tracer work? Our technology consists of three components. The first is our data collection pipeline. Information Tracer tracks public posts containing a particular URL, hashtag or keyword over five platforms—Twitter, Facebook, YouTube, Reddit, Gab. We will add more platforms in the coming months.
The second component is intelligence extraction. We implement a set of algorithms to turn heterogeneous data sources into explainable metrics that describe how information spreads. For example, one intuitive metric is Breakout Scale, a numerical value indicating the virality of a term. The higher the Breakout Scale value, the more viral the content is. Viral content does not imply that content is fake. These metrics become more powerful together. When people combine different Information Tracer metrics together, they can start to piece together when the sharing of content on social media might be the result of coordinated manipulation on the Internet.
The third component of Information Tracer is our information sharing pipeline. We provide a comprehensive set of API endpoints for developers who prefer to interact with our system programmatically. We also provide a web interface that allows analysts to quickly visualize information spread.
What we worked on and what’s next
During the NYC Media Lab AI and Local News Challenge, we had good opportunities to interact with experts with a wide range of backgrounds, from journalists and academics to entrepreneurs and NGO organizers. We were introduced to individuals who help us shape our focus and crystallize our value proposition.
Coming out of the challenge we have a clear picture of what types of users we want to serve. We plan to focus on 3 user groups – academic researchers, journalists or fact checkers, and technology companies building social media monitoring or social media understanding tools. At the table below we highlight potential use cases for each group of users and unique values Information Tracer brings.
For the next step, we will continue adding platforms and metrics to Information Tracer. Enhanced data coverage and intelligence are crucial to understanding the scope and intent of any information operation. We will also continue engaging with our above mentioned end users. We are already working with some research institutions and news organizations. We will take feedback from users and iteratively improve our product.
User: Academic Researcher. Use Case: Data collection. Value: Save time, enhance analysis
User: Journalists / Fact checkers. Use Case: Fact checking, evidence gathering. Value: Facilitate timely and accurate reporting; discover interesting events from noisy social media posts.
User: Technology companies in the social media field. Use Case: Bot detection, influence operation detection. Value: Enhance capability of a company’s product, ultimately adding protection to the end customers.
Team Description:
Zhouhan Chen is a data scientist and entrepreneur. He is the founder of Safe Link Network, a technology company with a mission to make the Internet a safer and more equitable place. He has previously worked at security teams at Twitter, Google and Amazon, helping them identify fake accounts, malware and suspicious websites. Zhouhan has a PhD in Data Science from New York University, and a Masters of Science in Computer Science from Rice University.
Joshua A. Tucker is Professor of Politics, an affiliated Professor of Russian and Slavic Studies, and an affiliated Professor of Data Science at New York University. He is the Director of NYU’s Jordan Center for Advanced Study of Russia. He is one of the co-founders and co-Directors of the NYU Center for Social Media and Politics (CSMaP) and the Social Media and Political Participation (SMaPP) laboratory. Professor Tucker has been at the forefront of efforts to explore the effects of social media on political participation and politics, as well as developing methods for utilizing social media data to study politics in new ways. His research has included studies on online hate speech, disinformation, fake news,Russian bots and trolls. He is the co-editor of Social Media and Democracy: The State of the Field, and the co-Chair of the independent academic research team on the 2020 US Election Facebook Research Study.