Applied Dynamics Lab
Marc Frank and Ramona Fittipaldi
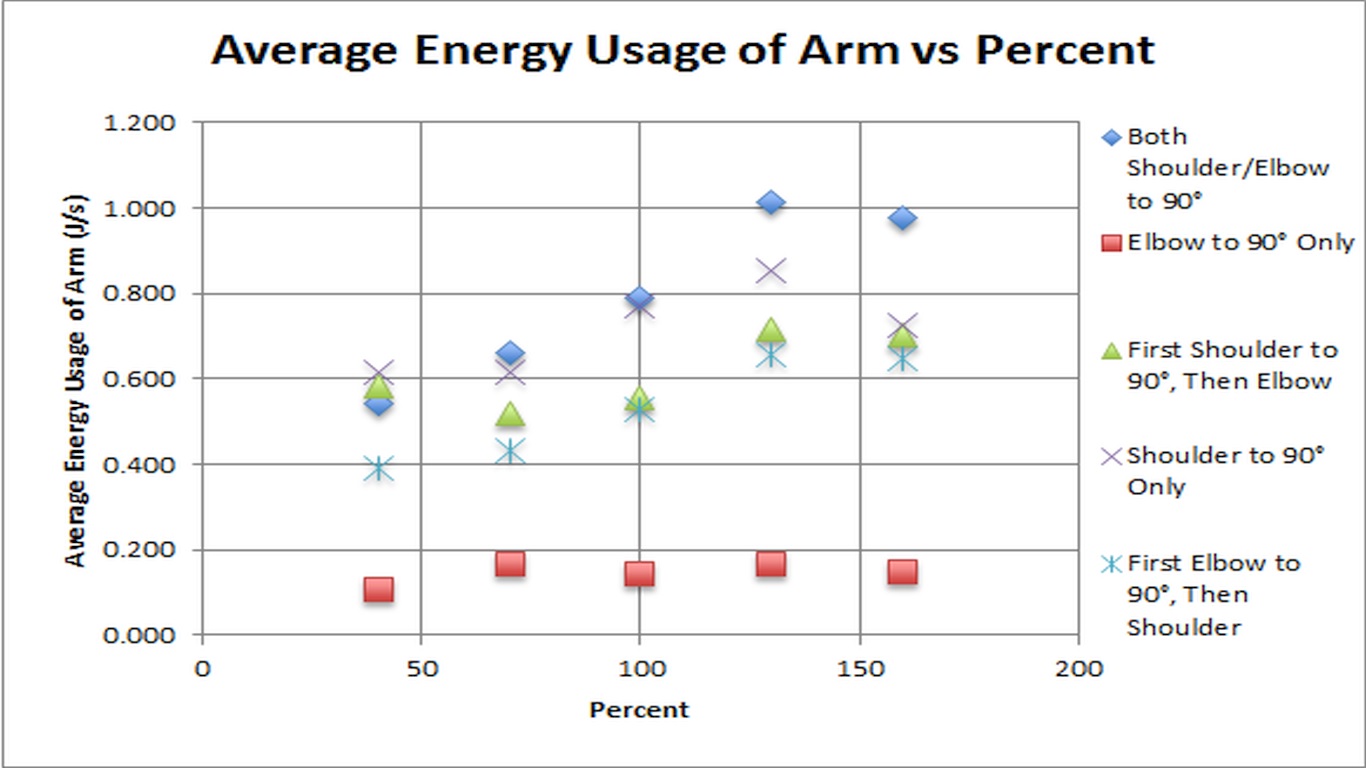
This week we analyzed our 18 static and 25 dynamic tests from last week by creating excel overview files of the data. In these overviews, we displayed graphs of the total elbow, shoulder, and arm power, the average energy usage of the elbow, shoulder, and arm, and the total energy of the elbow, shoulder and arm. A visual representation of the average energy usage of the arm vs. percent is displayed below. In addition, we graphed the angles for the static tests and the different trajectories for the dynamic tests as a confirmation of our experiments.
