Geographic Information Systems — Fall 2023
Explore student work showcasing GIS concepts through interactive maps and data visualizations using ArcGIS StoryMaps.

Overview
In the Fall 2023 semester, students in the Geographic Information Systems (CUSP-GX 5053) course led by Industry Assistant Professor Anton Rozhkov completed ten ArcGIS Storymaps reports.
Throughout the latter part of the semester, teams had the opportunity to dedicate several weeks to the development of research questions, exploration of their chosen topics to solve real-world problems, and the utilization of GIS tools to address these inquiries. Students were not only encouraged but also empowered to employ a variety of analytical techniques and tools covered in the course. These encompassed geoprocessing tools such as buffer, clip, intersect, geocoding, working with rasters, density heatmaps, interpolation, table and spatial joins, data management, and more. Additionally, emphasis was placed on the skillful use of symbology, labeling, color selection, map projection, and layout design.
The culmination of their efforts resulted in a compelling ArcGIS Storymap report. Within this report, maps and supplementary information were ingeniously employed to illustrate methodologies and effectively communicate their findings. A heartfelt appreciation goes out to all the students for their unwavering dedication and hard work throughout the semester.
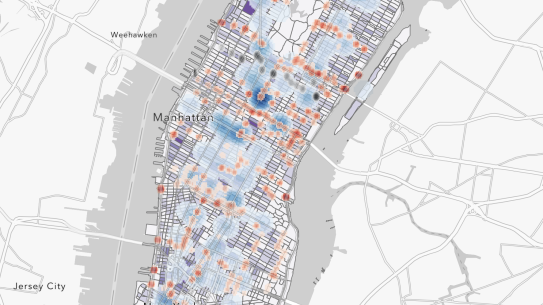
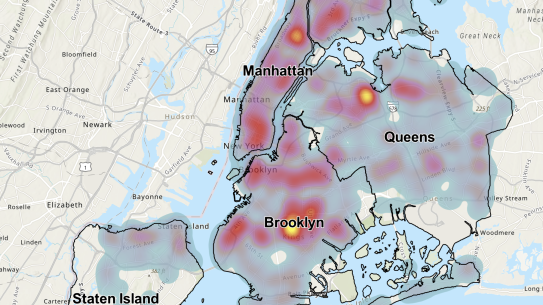
Crime Analysis in New York City 2023
Are you aware of the high-density crime areas in New York City?
Authors: Zhiyi Xie, Yuntian Wu
As indicated by the 2020 census, New York City is the most densely populated city in the United States, with a staggering 29,302.66 people per square mile, ranking it first in terms of population density. Furthermore, Neighborhood Scout's crime index places New York City at a 15 on a scale where 100 represents the safest, meaning it is only safer than 15 percent of U.S. cities, with a crime rate of 24.83 incidents per 1,000 residents. This statistical backdrop paints a picture of a metropolis grappling with complex safety challenges. The intricate interplay of a high population density, diverse urban landscape, and varying crime rates necessitates a deeper investigation into the patterns of crime. This project leverages ArcGIS Pro to analyze when and where crimes occur, aiming to gain actionable insights into the city's multifaceted crime landscape, ultimately contributing to more informed and effective urban safety strategies.
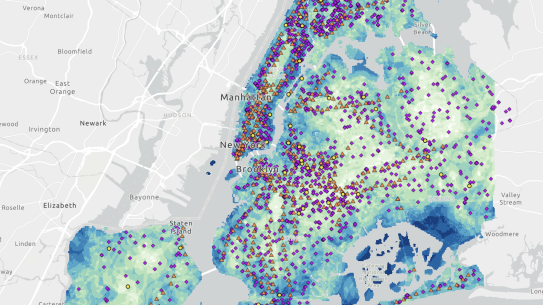
Flood Susceptibility of Critical Infrastructure in NYC
Authors: Madison Buchholz, Ruixin Gan, Yifei Wang
According to FEMA, flooding occurs when there is a partial or complete inundation of normally dry land area. Flooding may result from overflow of inland or tidal waters, unusual and rapid accumulation or runoff of surface waters, mudslides, or collapse of land along the shore of a body of water (Federal Emergency Management Agency, 2020). The project offers a spatial analysis of flood risk of critical infrastructure across New York City. It emphasizes the role of drainage systems, proximity to parks, and location within flood risk zones in shaping this susceptibility. Through GIS analysis and case studies, it provides insights into flood mitigation strategies and recommends integrating green infrastructure into urban planning to enhance resilience, especially in the context of climate change and rising sea levels.
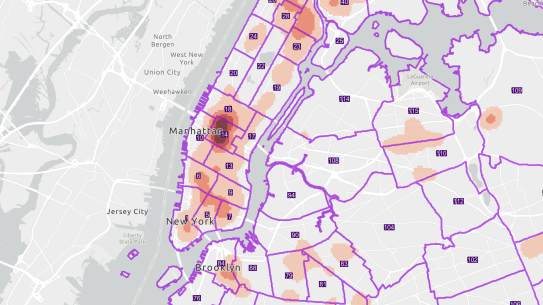
Uncovering Medical Service Deserts in Urban Centers
Authors: Jiyun Cho, Devang Dave, Sonali Mhatre
This project focuses on mapping hospital facilities in New York City using ArcGIS. The idea stemmed from personal experiences of individuals facing difficulties in emergencies, prompting a desire to determine whether citizens in New York City have adequate access to medical services. The primary mapping utilizes data on healthcare facilities in New York City, specifically the population density for the year 2020, hospital locations, and population data collected by NTA (Neighborhood Tabulation Areas as created by the NYC Department of City Planning using whole census tracts). The analysis aims to provide insights into how many individuals a hospital should accommodate based on the population.
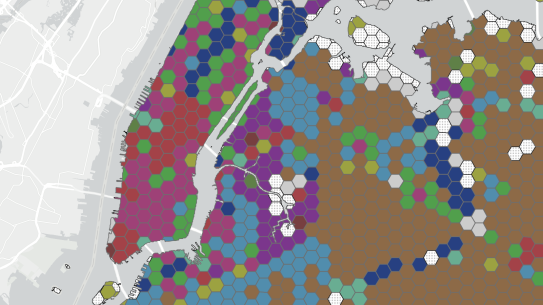
Characterizing New York City's One-Way Streets
Authors: Ole Siever, Malik Salman
One-way signs are a common occurrence in many North American streetscapes. In New York City, they are particularly common — and as much part of the city’s image as its steel subway cars. The beginnings of a trend to designate streets as one-way can be found as early as in the 1910s (Gray, 1997). Since then, their number has been constantly growing. Nevertheless, one-way streets are a contentious topic: Advocates often cite safety, capacity and convenience as major advantages of one-way streets (Stemley, 1998). Opponents, on the other hand, argue that safety on one-way streets is negatively impacted by their tendency to encourage speeding and reckless driving (Badger, 2015). Contentious or not, though, one-way streets are omnipresent. We wanted to understand their presence in New York City better, particularly their spatial distribution, and the types of land uses that most commonly surround them. On this basis, we formulated two research questions:
(1) Are there community districts in NYC that have greater proportions of one-way streets?
(2) Do one-way streets tend to be particularly common for specific types of land uses?
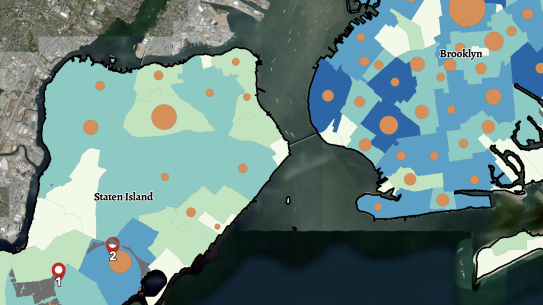
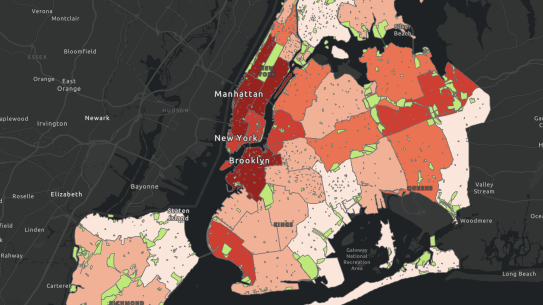
Green Spaces in NYC: A Public Health Perspective
Authors: Akanksha Patil, Koyel Das and Vinayak Saxena
In the midst of bustling city life of New York City, our project delves into the intricate relationship between urban green spaces and public well-being. Utilizing geographic analysis with ArcGIS Pro, we scrutinize the impact of accessible green areas on critical health indicators. GIS is a vital tool in this context as it allows us to visualize, interpret, and analyze spatial data, providing a dynamic platform to map and understand the distribution of urban green spaces and their potential influence on public health. Our central question explores whether there is a significant correlation between urban green space accessibility and public well-being. With a hypothesis suggesting improved well-being with increased green space access, we embark on a journey to decipher the patterns that connect urban landscapes and the health of their inhabitants, shaping healthier and more harmonious cityscapes.
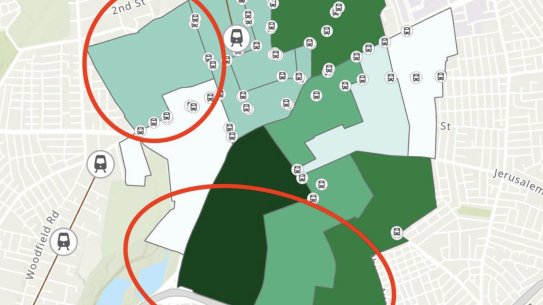
Navigating Hempstead
Enhancing Transit Connectivity in Hempstead New York
Authors: Emanuel Simmons, Xinghong Wang
The Village of Hempstead, situated in Nassau County, New York, is characterized by its rich demographic diversity and unique socio-economic landscape. The village consists of a dense population of 59,000 residents, making it the most densely populated village in the county. The demographic reflects a majority-minority population, with a significant percentage identifying as Hispanic or African American, constituting 89% of the population. Hempstead grapples with challenges that affect its accessibility and connectivity. The frequency of car ownership in the community introduces complexity to travel patterns, and existing policies may not fully align with proposed transit enhancements. The village's density, economic characteristics, and demographic composition make it a focal point for transportation planning that addresses the unique needs of its residents. Understanding these dynamics is crucial for crafting equitable and inclusive transit strategies that contribute to the overall well-being of the community.
Distribution and Accessibility of Churches in New York City
Authors: Yanqing Chen, Guanqi Fu, Ziyi Wang
In New York City, known for its diverse people and neighborhoods, churches are more than just places for prayer; they're important parts of the community, providing an indispensable aid to the city's economic and spiritual development. This study analyzes the relationship between the location of churches in cities and population density and income status, and of course the effect of the extent of transportation routes on site selection. By examining the patterns of population distribution and income in the vicinity of churches, we were able to visualize and visualize this information in the form of maps, and to delve deeper into potential trends in these areas. It is hoped that based on our findings we can help shape the social and economic patterns that characterize New York City.
Tracing NYC Shootings' Links to Schools and Subway Stations
Author: Becky Hsu
The proximity of the NYU Tandon campus to several busy subway stations, which are integral to the daily commute of thousands of New Yorkers, adds a layer of complexity and concern. It is alarming to observe that such violent incidents are not isolated occurrences but part of a broader pattern of shootings that have been happening with unsettling regularity in the vicinity. This pattern raises pressing questions about the safety of spaces that are traditionally considered secure, like educational institutions and public transit hubs. This situation calls for a united front involving students, educational authorities, and law enforcement agencies like the NYPD. We must collectively endeavor to understand the root causes of these shootings, implement robust safety measures, and foster an environment where students can pursue their academic goals without the looming shadow of fear. As we delve deeper into this issue, it becomes imperative to not only seek answers but also to actively participate in creating a safer, more secure academic environment for everyone in New York City.
Assessing the Impact of Public Transportation Accessibility
Authors: Jia Dong, Wujun Zhou, Yiming Jiang
With continual urban development and population expansion, housing prices have increased rapidly in many metropolises. High property value affects the disposable income, quality of life, choice of accommodation location and transport needs of urban residents. Housing affordability is a significant issue in New York City, influenced by various factors, including access to public transportation. Because of the huge external benefits that exist in public transportation, the analysis about the impact of public transportation on real estate prices has been a hot research topic in the academic world. W. Alonso introduced the economic theories of marginal returns of location and marginal equilibrium of location, put forward the theory of competing rent, and constructed the concentric circle model of urban land use in the study of the relationship between location and land use. W. Bruce Allen studied the impact of the subway from Philadelphia to New Jersey on the price of residential land in the neighborhood and found that if the transportation cost decreased by 1 US dollar, the price of residential land increased by 443 US dollars, which shows that the convenience of the subway has a great impact on the price of residential land in the neighborhood.

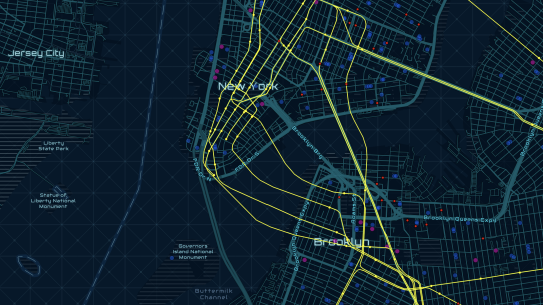
Spatial Associations between Transportation and Commerce
Authors: Feiyang Ren, Xueliang Yang
The interplay between economic activities and transportation forms a dynamic cycle, characterized by spatial and temporal shifts within both systems. Changes in the spatial distribution of economic activities can reshape travel demand patterns, subsequently influencing modifications in the transportation infrastructure. Inversely, advancements in transportation infrastructure elevate accessibility, thereby catalyzing shifts in the spatial arrangement of economic activities. Notably, the proliferation of retail locations predominantly occurs within a 100-meter radius of rail transit stations. This underscores the 'corridor effect' of rail transit on socio-economic activities in urban areas, as detailed in the study by Ma et al., 2023. In Manhattan, a unique urban landscape characterized by a dense network of subway tracks, roads, and bike paths, we expect to uncover similar trends. Our project aims to delve deep into these spatial relationships, focusing on how subway lines, along with vehicular and bicycle traffic flows, shape and are shaped by commercial trends. By integrating comprehensive ridership data with commercial activity patterns, we aim to provide a nuanced understanding of how transportation infrastructure not only supports but also drives economic activity.